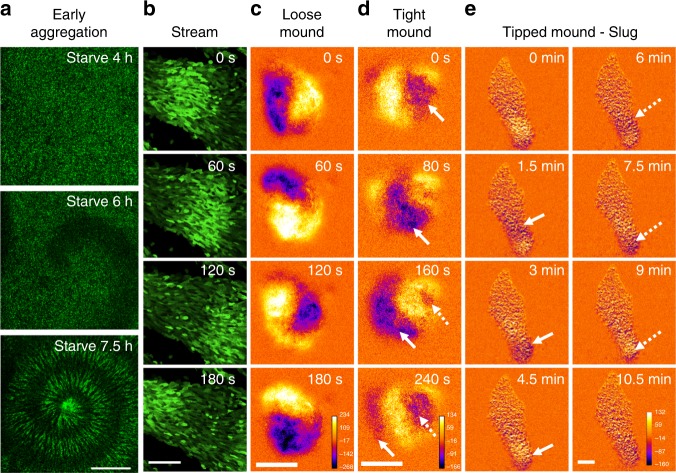
Fig. 1.
Typical cAMP signaling dynamics at each developmental stage of Dictyostelium cells visualized by Flamindo2. a Spiral pattern of a [cAMP]i wave in cell populations at early aggregation. b Wave propagation in an aggregating stream. c Rotational propagation in a loose mound. d Wave propagation from the top of a tight mound (right side of images) to the bottom. e A slug with a stream elongating toward the top of the images. In c–e, images were subtracted at 3–6 frame intervals to emphasize changes in fluorescence intensity. Solid and broken arrows show the positions of the first and second waves in each sequential image, respectively. Scale bars, a 1 mm, b, e 100 μm, c, d 50 μm

