Fig. 2.
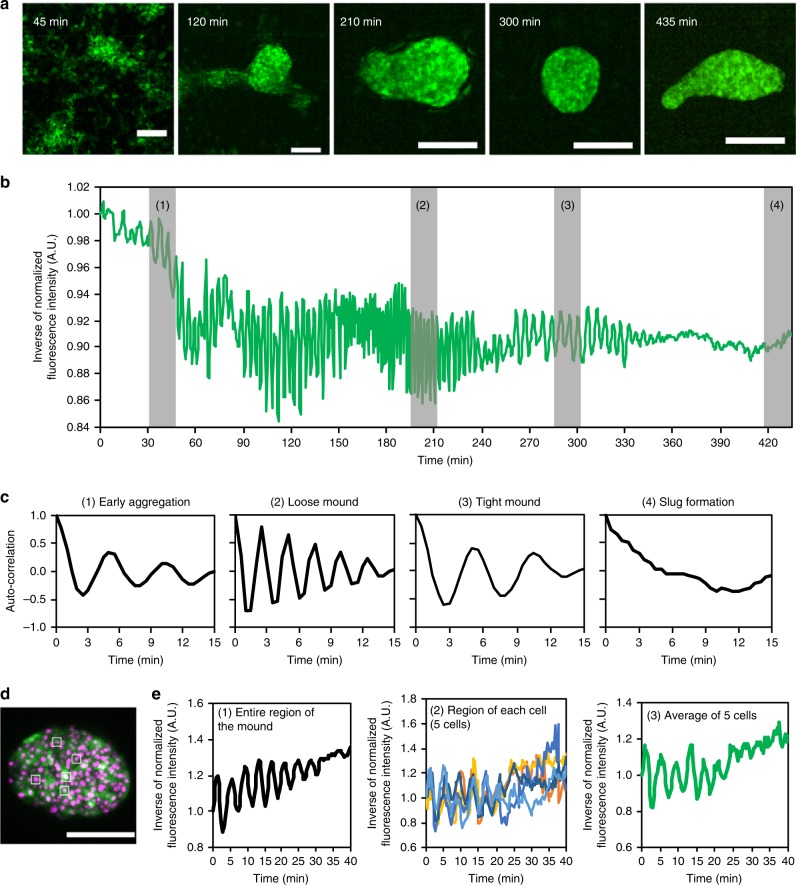
Disappearance of [cAMP]i oscillations during development. a Fluorescent images of Dictyostelium cells expressing Flamindo2 in each developmental stage. Maximum intensity projections of Z-stack images are shown. Scale bars, 100 μm. b Time course plot of inverse Flamindo2 signals during development from the onset of aggregation to slug formation. Data were obtained 3.5–10.75 h after starvation. The mean intensity of Flamindo2 in a 30 μm2 region in the cell population shown in a was measured. c Autocorrelation of Flamindo2 signals at each development stage are shown by the gray bars in b. d A fluorescence image of Flamindo2 and Histone2B-RFP in an elongating mound. The maximum intensity projection of Z-stacks is shown. Scale bar, 50 μm. e Time course plot of inverse Flamindo2 signals at the tissue (first) or individual cell level (second and third) in the mound shown in d. First, average signals in the entire region of the mound. Second, signals in 5 cells indicated by the white boxes in d. In the second graph, individual cells were tracked, and Flamindo2 intensities within each cell were measured. Third, average of the signals in the second graph

