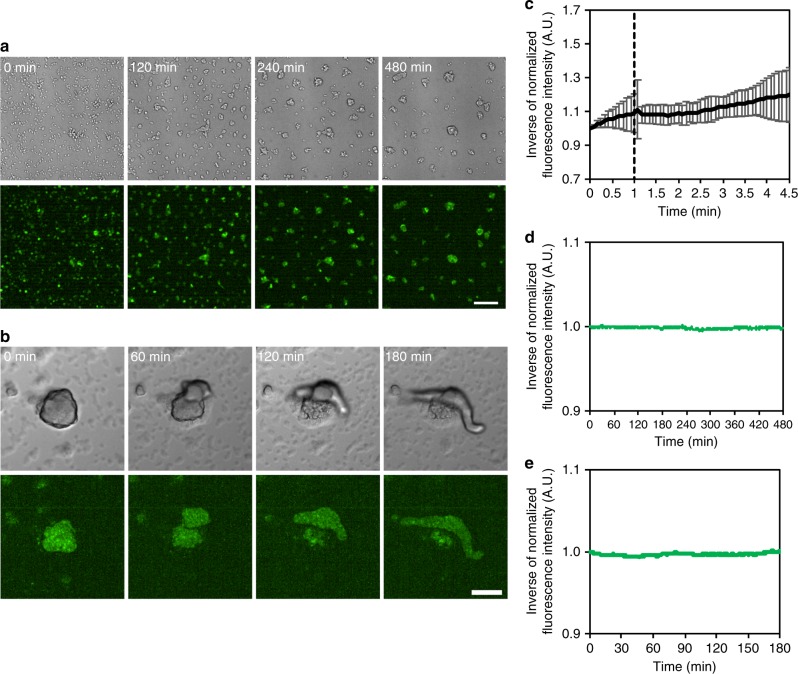
Fig. 5.
Development of acaA-null cells without [cAMP]i oscillations. a Aggregation of acaA-null cells expressing Flamindo2 in DB with exogenous cAMP pulses under microscopic observation. Top panels, DIC images. Lower panels, fluorescent images of Flamindo2. Scale bar, 100 μm. b Slug formation of acaA-null cells expressing Flamindo2 on agar. Cells were washed and deposited on an agar plate after cAMP pulses. Upper panels, DIC images. Lower panels, fluorescent images of Flamindo2. Inside the fluorescent images, maximum intensity projections of Z-stacks are shown. Scale bar, 100 μm. c Time-course plot of Flamindo2 signals in cell clumps after 100 μM cAMP stimulation. The mean intensity of Flamindo2 in a 25 μm2 region in the cell mass was measured, and the inverse of the fluorescence intensity of Flamindo2 is plotted on the y-axis (mean ± SD, n = 13 clumps). d Time-course plot of Flamindo2 signals in acaA-null cells during aggregation. The mean intensity of Flamindo2 in a 100 μm2 region on the aggregation field shown in a was measured, and the inverse of the fluorescence intensity was plotted against time. e Time-course plot of Flamindo2 signals in acaA-null cells during slug formation. The mean intensity of Flamindo2 in a 100 μm2 region in the cell mass shown in b was measured, and the inverse of the fluorescence intensity was plotted against time

