Fig. 6.
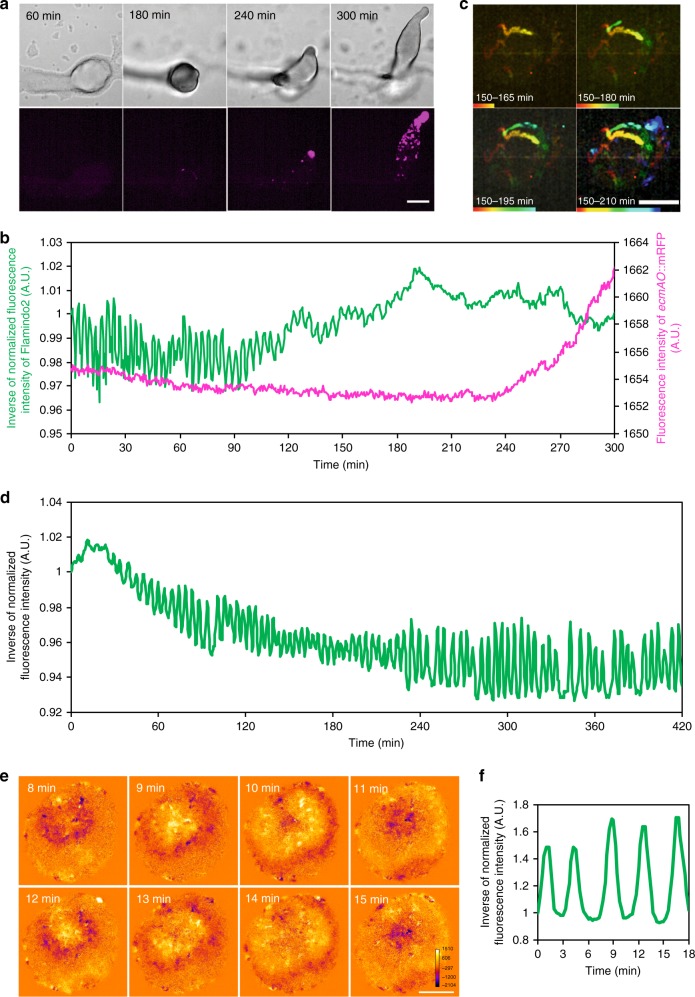
Association of cAMP signaling transition with developmental progression. a Expression of ecmAO::mRFPmars during mound development. Upper panels, DIC images. Lower panels, fluorescent images of ecmAO::mRFPmars. Scale bar, 100 μm. b Time course plot of Flamindo2 (green) and ecmAO::mRFPmars (magenta) signals during mound development. Data were obtained 8–13 h after starvation. The mean intensity of Flamindo2 in a 30 μm2 region in the mound shown in a and the mean intensity of ecmAO::mRFPmars in the entire region of the mound were measured. c The sorting of cells expressing ecmAO::mRFPmars at the top of the tight mound. This figure shows trajectories of sorted prestalk cells marked by the expression of ecmAO::mRFPmars at the top of the mound (upper right side of images) during the mound elongation. Scale bars, 100 μm. d Time course plot of inverse Flamindo2 signals during the development of gbfA− cells. Data were obtained 3–10 h after starvation. The mean intensity of Flamindo2 in a 50 μm2 region of the cell population was measured. e Wave propagation of Flamindo2 signals in the loose mound of gbfA− cells after 24 h starvation. Images were subtracted at 4 frame intervals to emphasize changes in the signals. Scale bar, 50 μm. f Time course plot of inverse Flamindo2 signals in the mound shown in e. The mean intensity of Flamindo2 in a 20 μm2 region in the mound shown in e was measured

