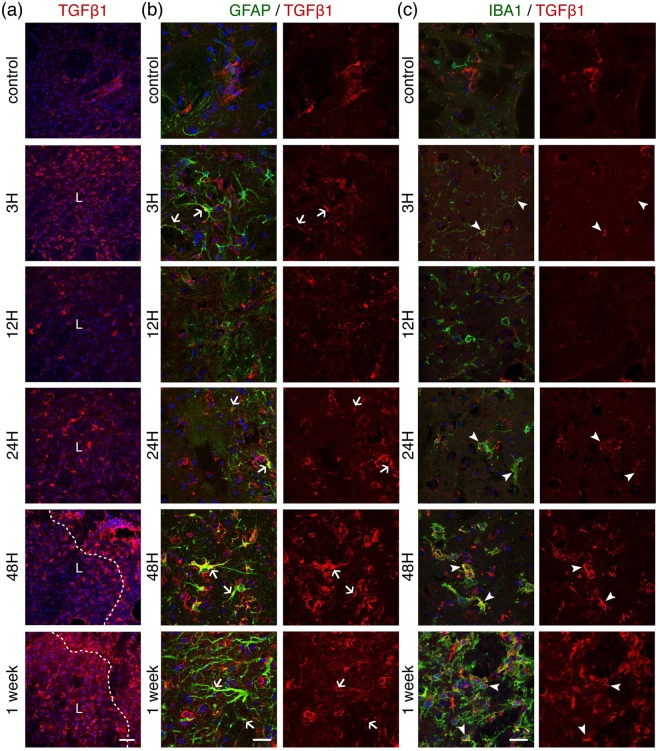
Figure 7.
Temporal evolution of the tissue-repair cytokine Transforming Growth Factor β1 (TGFβ1) after 30 minutes MCAO. (a) Low magnification images from ipsilateral to lesion striatal tissue sections taken at different time-points after ischemia and immunostained for TGFβ1 (red). A dashed line indicates the lesion boundary (L). Scale bar: 50 μm. Sections were counterstained for reactive astrocytes ((b), GFAP staining in green) or microglia ((c), Iba1 staining in green) and shown at higher magnification. Arrows (astrocytes) or arrohweads (microglia) point towards cells that express TGFβ1. DAPI (blue) was used as a nuclear counterstaining. The images shown are representative of at least three animals per time-point. Scale bars: 20 μm.

