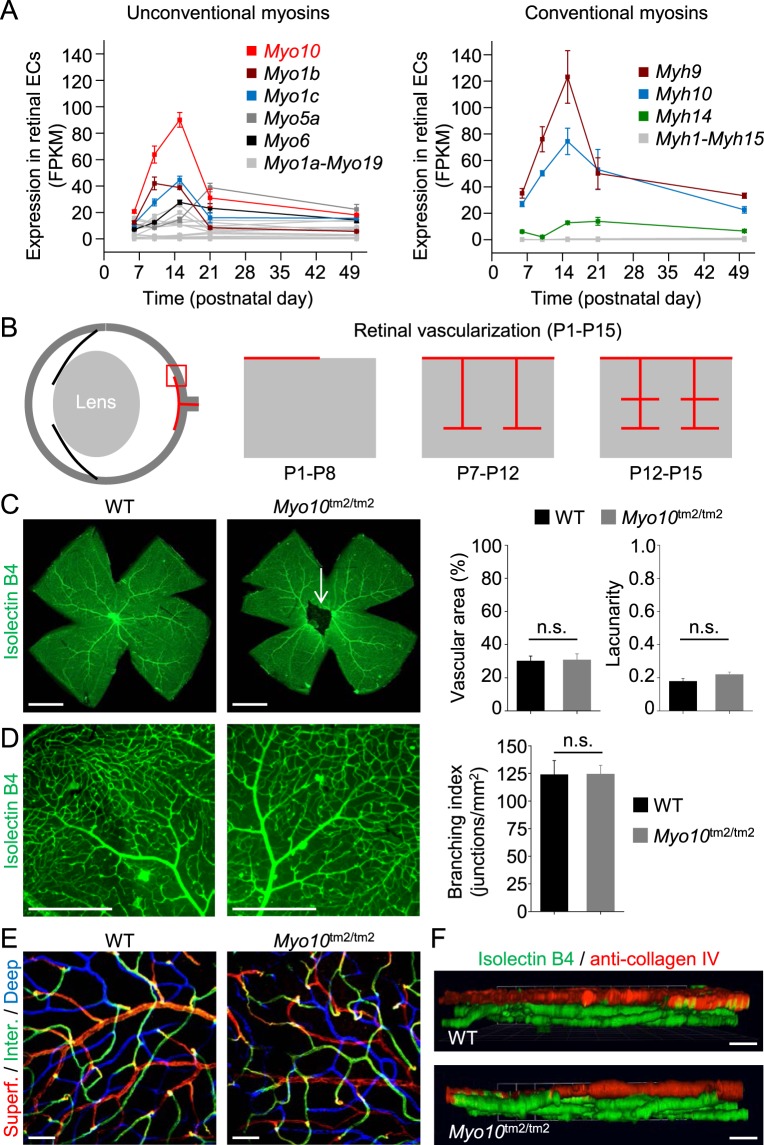
Figure 9.
Myo10 expression in retinal vascular endothelial cells and retinal vascularization in Myo10tm2/tm2 mice. (A) Expression profile of the myosin superfamily in postnatal retinal endothelial cells. Notably, RNA sequence analysis revealed increased expression of Myo10 between postnatal day 6 (P6) and P15 (n = 3 independent preparations per group). (B) Schematic diagram showing vascularization of the deeper layers of the retina between P7 and P15. (C) Whole-mount retinas from wild-type (WT) and Myo10tm2/tm2 mice stained for blood vessels (representative of 6 preparations for each genotype). The white arrow indicates persistent hyaloid vessels. Quantitative analysis of the vascularization of WT versus Myo10tm2/tm2 retinas is shown on the right (n = 6 retinal preparations (from 3 mice) for each group). Vascular area is the percentage of area covered by the vascular network and lacunarity is a measure of heterogeneity. Scale bars: 1 mm. (D) Higher magnification images of isolectin B4-stained retinal blood vessels. Quantitative analysis of vessel branching (branch points/unit area) is shown on the right. Scale bars: 500 µm. (E) Higher magnification images (obtained using a 20x/0.45 objective lens) of retinal vascular layers, color coded blue (deep plexus), green (intermediate (inter.) plexus) and red (superficial (superf.) plexus). Scale bars: 50 µm. (F) Side-view projections of 3D reconstructions of retinal vessels, obtained by spinning disk confocal microscopy (via a 20x/0.45 objective lens). Anti-collagen, type IV, stained the superficial plexus (red), whereas all vessels were labeled with isolectin B4 (green). Scale bars: 100 µm.

