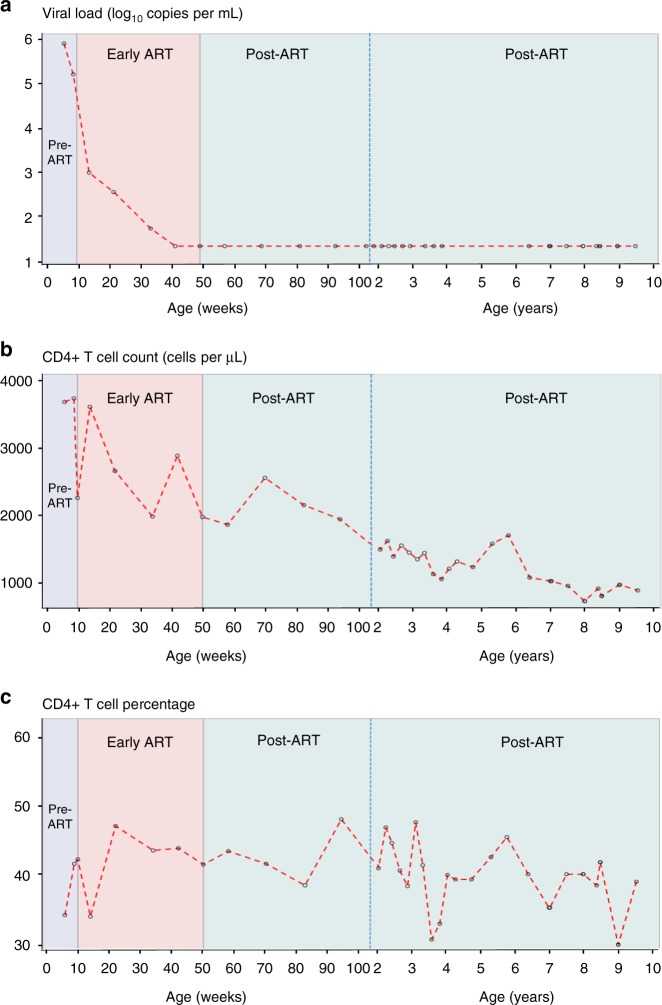
Fig. 1.
Longitudinal viral loads and CD4+ T cell counts. a–c Viral load (log10 RNA copies per mL) (a), absolute CD4+ T cell count (cells per µL) (b) and CD4+ T cell percentage (c) are shown over time up to age 9.5 years (open circles joined by red dotted lines). Pre-ART, early ART and post-ART periods are indicated (shaded in lavender, pink, pale green, respectively). The X-axis shows age in weeks and then in years, separated by a blue vertical dotted line. Note: the detection limit of the VL assays used was 400 RNA copies per mL at 10.71 and 116.71 weeks; 50 RNA copies per mL at 33.71 weeks and 20 RNA copies per mL at all other time points. ART antiretroviral therapy

