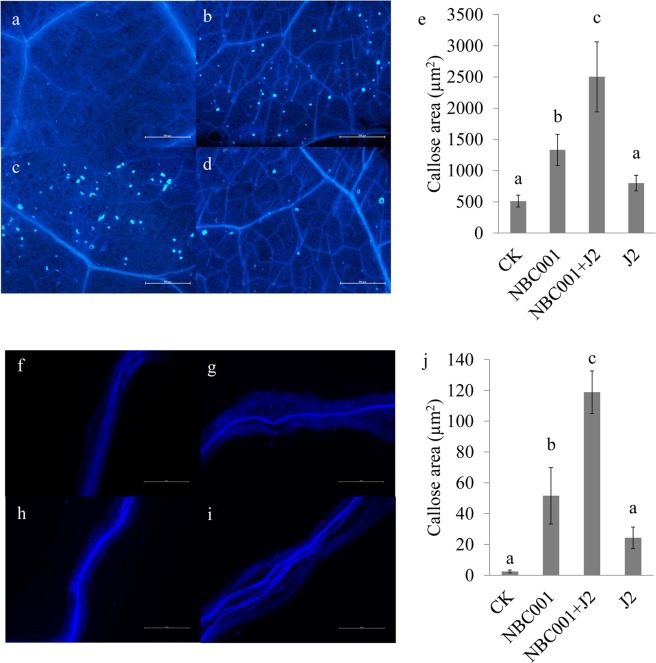
Figure 6.
Histochemical analysis of cell wall reinforcement in the leaves and roots of soybean at 24 h post-inoculation. (a,f) Control, (b,g) NBC001 treatment, (c,h) NBC001 + J2 treatment, and (d,i) J2 treatment. Scale bars represent 500 μm. (e,j) Callose deposits were quantified using ImagePro 5.0 software. The values are the mean callose deposits area ± standard deviation from 20 pieces of leaves (diameter, 1 cm) or the roots from five plants.

