Figure 4.
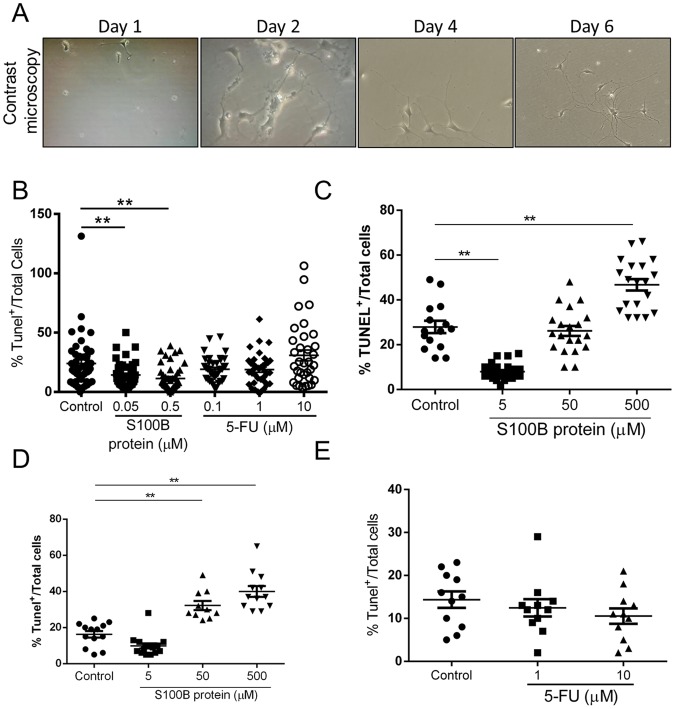
Higher concentration of S100B induces enteric neuronal cell death. (A) Representative images of enteric neurons in vitro in different time points (day 1–6) in contrast microscope. (B) Cells were treated on day 0 with S100B (0.05 µM or 0.5 µM) and 5-FU (0.1 µM, 1 µM or 10 µM) for 24 h. Graph represents the mean ± SEM of the percentage of TUNEL positive cells relative to total cells in eight distinct fields of each well per group from 5 different experiments. (C) Cells were treated on day 0 with S100B (5 µM, 50 µM and 500 µM) for 24 h. (D) Cells were treated on day 4 with S100B (5 µM, 50 µM and 500 µM) for 24 h. (E) Cells were treated on day 4 with 5-FU (1 µM and 10 µM) for 24 h. Graph represents the mean ± SEM of the percentage of TUNEL positive cells relative to total cells in three distinct fields of each well per group from 2 different experiments. All images were analysed using ImageJ software. **P < 0.01. One-way ANOVA followed by Bonferroni.

