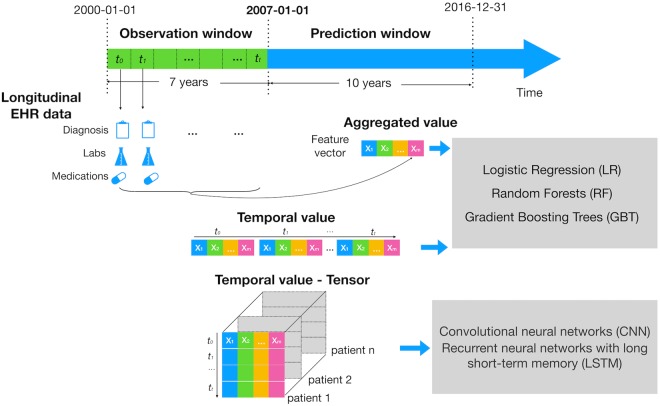
Figure 3.
Study design of experiment I. The figure illustrates how we defined the observation and prediction window. It also shows how we modeled longitudinal EHR features: i) We aggregated each feature across the 7-year observation window (e.g. median, max, min and SD of HDL); ii) we extracted each year value of each feature and concatenated the temporal values from all patients into a two-dimensional matrix for a classifier (e.g. LR, RF, GBT); we then constructed a tensor representation on temporal values from all patients for CNN and LSTM.

