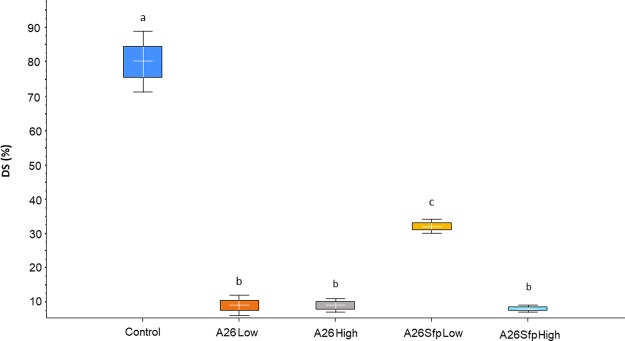
Figure 4.
Fusarium Head Blight disease severity (DS) in greenhouse assay. Boxplot of DS scores after Paenibacillus polymyxa A26 and P. polymyxa A26∆sfp treatments at two inoculum densities, 106 (Low) and 108 (High) cells/ml. ANOVA univariate analysis was performed and post hoc LSD test used to identify treatments significantly different from pathogen control (p < 0.05). Different letters indicate statistically significant differences. Error bars represent standard deviations.

