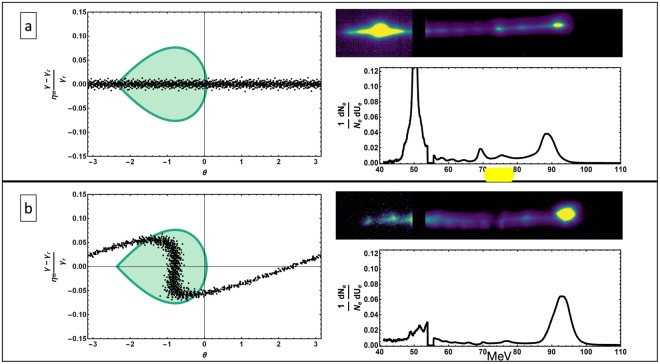
Figure 2.
The left side figures present the electron beam longitudinal phase-space distribution overlaying the stable phase-space area due the accelerating potential. The shaded area in the (η, θ) plots signifies this stable phase-space that is captured and subsequently accelerated. The electron spectrometer images and lineouts, in the right side figures, show the significant increase in capture efficiency when the pre-buncher is employed to load the initial electron beam distribution centered at − π/4 phase of the ponderomotive potential.

