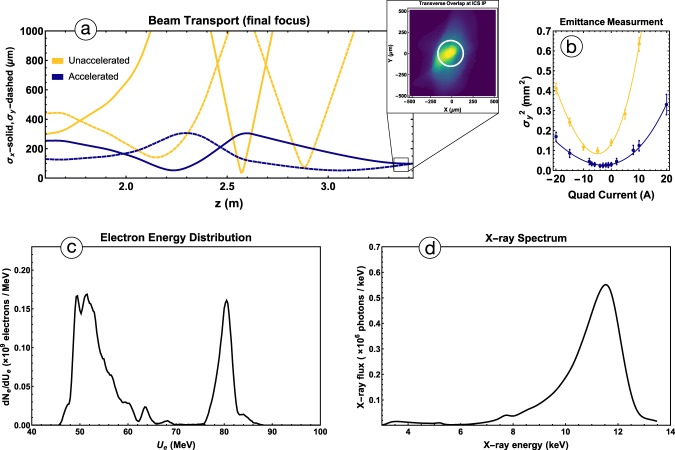
Figure 4.
(a) The transverse beam envelopes σx and σy for both accelerated and unaccelerated beams The emittance measurement shown in (b) is used as input for particle tracking, in the (a), (c) IFEL simulated electron energy spectrum. Although the spectrum shows a large population of unaccelerated electrons, the focus into the ICS IP (see (a)) is set to produce a transverse focus only for higher energy electrons. This translates into a simulated X-ray spectrum, shown in (d), that is dominated by 12 keV photons. The inset of (a) is the transverse profile of the electron beam at the ICS IP σx × σy = 140 × 170(±10) μm; the superimposed circle marks the estimated CO2 FWHM at the IP ~ 150 μm. The measurement in (b) confirms the preservation of the beam normalized emittance during the IFEL acceleration. Emittance measurement data was taken for both the unaccelerated beam and accelerated beam, yielding normalized emittance values of 2.3 ± 0.1 μm and 2.4 ± 0.15 μm, respectively. The error bars are calculated based on the resolution of the transverse position monitors and the statistics of the measurement.

