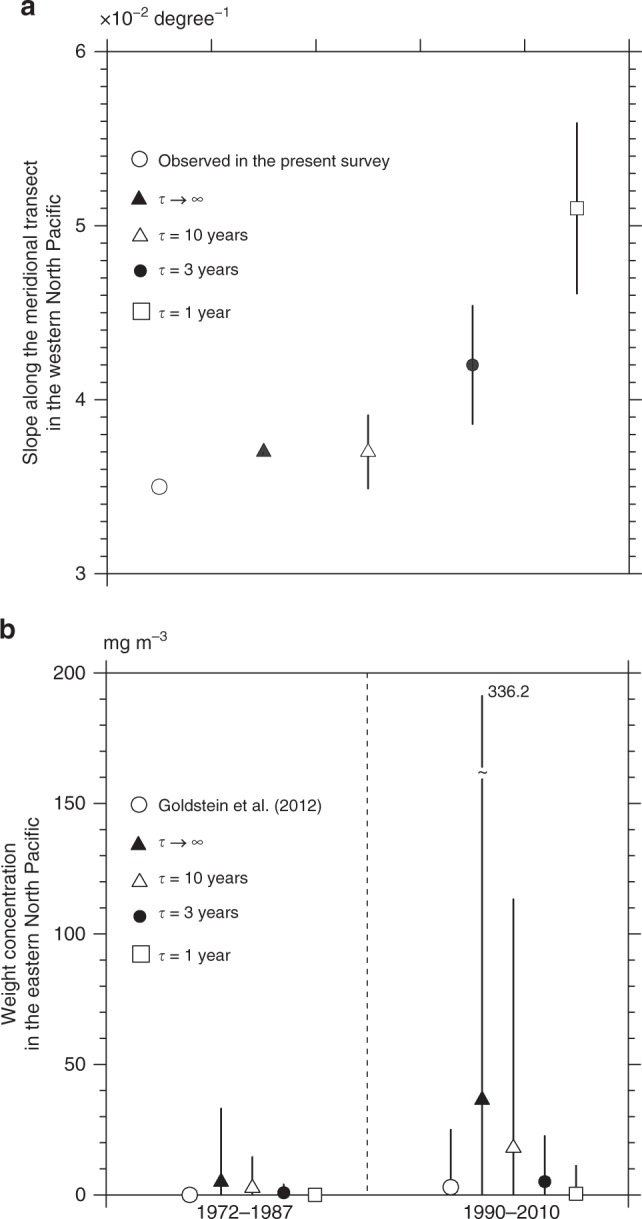
Fig. 5.

Dependence of microplastic abundance on τ. In a, the slopes (λ) of the exponential curve representing the meridional variation of the total particle counts are compared between the meridional transect in 2016 and models with a different average transit time (τ) in the North Pacific. In b, weight concentrations averaged between 1972 and 1987 are compared with those averaged between 1990 and 2010 using the estimates given by Goldstein et al.3 and models with a different τ. The weight concentrations were averaged over the box from 130°W to 170°W, and from 20°N to 40°N. The marks denote the median for each case, while the upper (lower) end of the bars represents the 95th (5th) percentile in line with the estimate by Goldstein et al.3. The 95th percentile for the model without the sink (i.e., τ → ∞) in 1990–2010 is shown by the digit at the top of the bar because the value exceeds the upper limit of b
