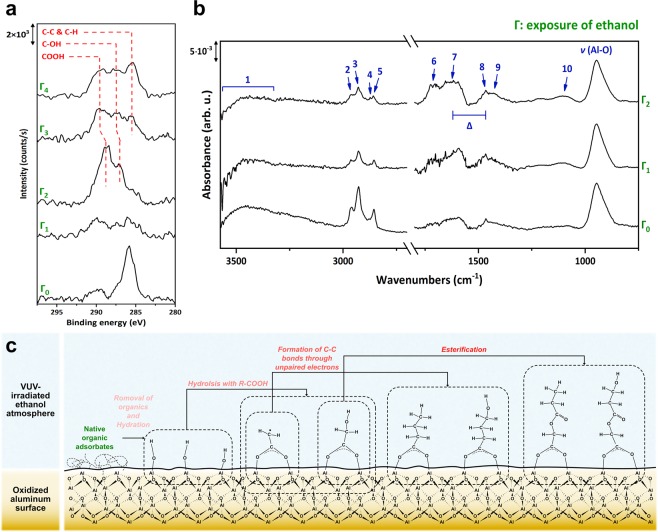
Figure 2.
E-VUV-induced reorganization of ethanol present on a metal surface. (a) Evolution of XPS C 1s spectra for the aluminum surface subjected to the E-VUV process. The exposure (Γ) of ethanol with a numerical subscript from 0 to 4 represents 0, 218.4, 793.8, 1419.6, and 2087.4 (kg·s/m3), respectively. Note that the Γ2 spectrum was obtained at a takeoff angle 15° because the intensity at 45° was too low to distinguish chemical components. (b) ATR-FTIR spectra for the aluminum surface subjected to the E-VUV process. Γ0 to Γ2 indicate 0, 436.8, and 2507.4 (kg·s/m3), respectively. The symbol Δ denotes the peak separation between symmetric and asymmetric stretching vibrations of carboxyl groups, and is around 151 cm−1 in these spectra. (c) Illustration showing how the bridging layer forms on the aluminum surface with the E-VUV process.

