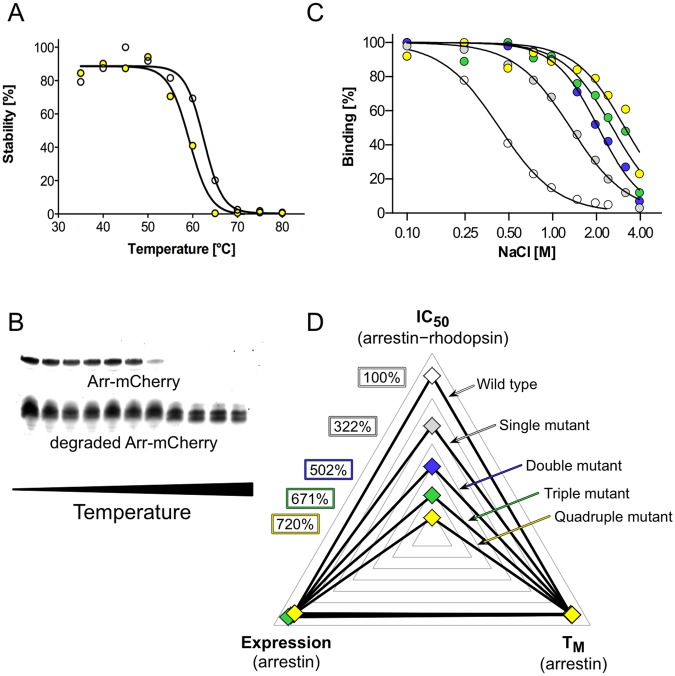
Figure 2.
Arrestin-1 mutant combination strategy and multi-dimensional screening. (A) Arrestin–mCherry protein TM detected by in-gel fluorescence for WT arrestin-1–mCherry (white circles) and quadruple arrestin-1–mCherry mutant R171A + E341A + T304A + F375A (yellow circles). (B) SDS in-gel fluorescence signal of an arrestin-1–mCherry quadruple mutant (R171A + E341A + T304A + F375A) decreases upon temperature-induced denaturation. In contrast, signal from degraded/aggregated arrestin-mCherry stays constant during the procedure. (C) Arrestin-1 mutants were combined in order to successively increase IC50 values. WT arrestin-1 (white circles), single mutant F375A (grey circles), double mutant E341A + F375A (blue circles), triple mutant E341A + T304A + F375A (green circles), and quadruple mutant D303A + E341A + T304A + F375A (yellow circles) are shown. (D) We selected and combined mutants with increased IC50 values, but with TM values and functional expression levels close to WT values. Color codes and mutants are the same as in (C). IC50 and TM values as well as functional expression levels are available in SI Table 1 and are normalized to WT arrestin-1.

