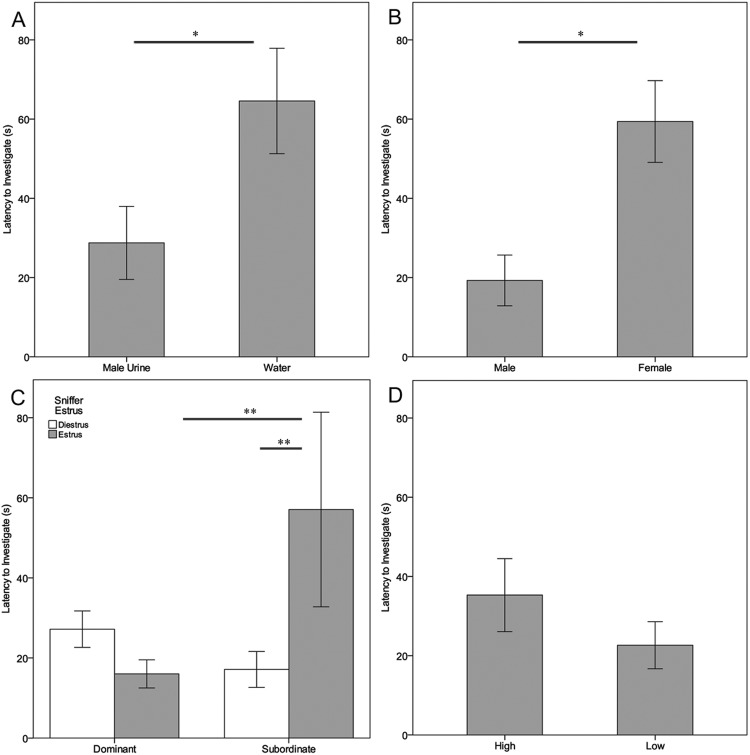
Figure 3.
Female olfactory preferences measured by latency to investigate two different urinary stimuli in a Y-maze apparatus: (A) adult male urine versus water (N = 15); (B) adult male versus adult female urine (N = 10); (C) dominant versus subordinate male urine (N = 10, tested in diestrus (white bars) and estrus (gray bars); and (D) high versus low urinary protein concentration of control males (N = 10, 3:1 PC ratio). Significance of p < 0.05 indicated by ‘*’, p < 0.01 indicated by ‘**’. Error bars indicate ± 1 s.e.m.

