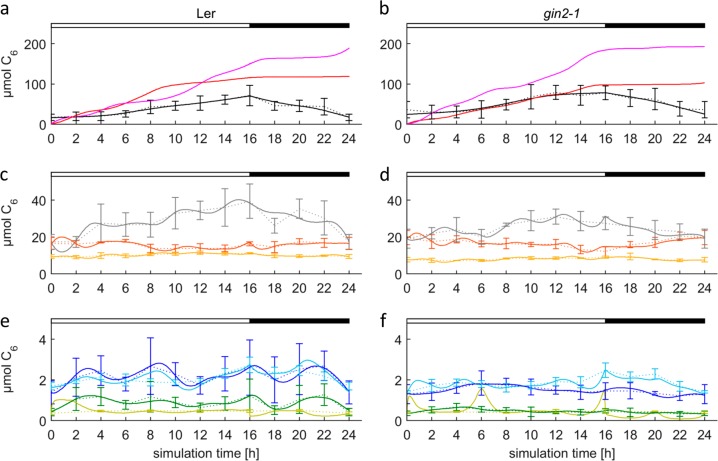
Fig. 2.
Simulated results for the final Model_ 08 under control condition. Dotted lines represent means of measured data ± SD (n = 6), solid lines represent means of model simulations (n = 5) for Ler (a, c, e) and gin2-1 (b, d, f). Day and night are indicated with white and black bars on top. Sucrose is expressed as C12. a, b starch (black), structural carbon (red), export (pink). c, d malate/fumarate pool (gray), citrate (orange), and amino acids (yellow). e,f glucose (blue), sucrose (turquois), fructose (green), and hexose phosphates (olive)

