
Figure 4.
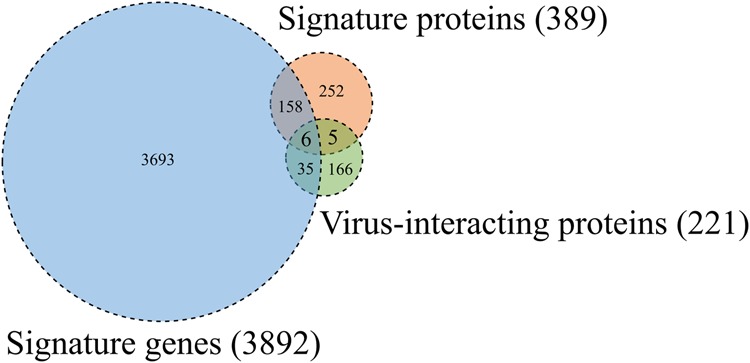
Venn diagram of signature genes, signature proteins, and human proteins that interact with dengue virus proteins. The number of signature genes obtained from the gene expression data with significant differences between DHF patients and normal controls is shown in the blue circle. The number of signature proteins obtained from the protein expression data is shown in the orange circle. The number of human proteins that interact with dengue virus proteins in human–virus PPIs is shown in the green circle. The numbers of gene products and proteins that overlap between the groups are also shown.