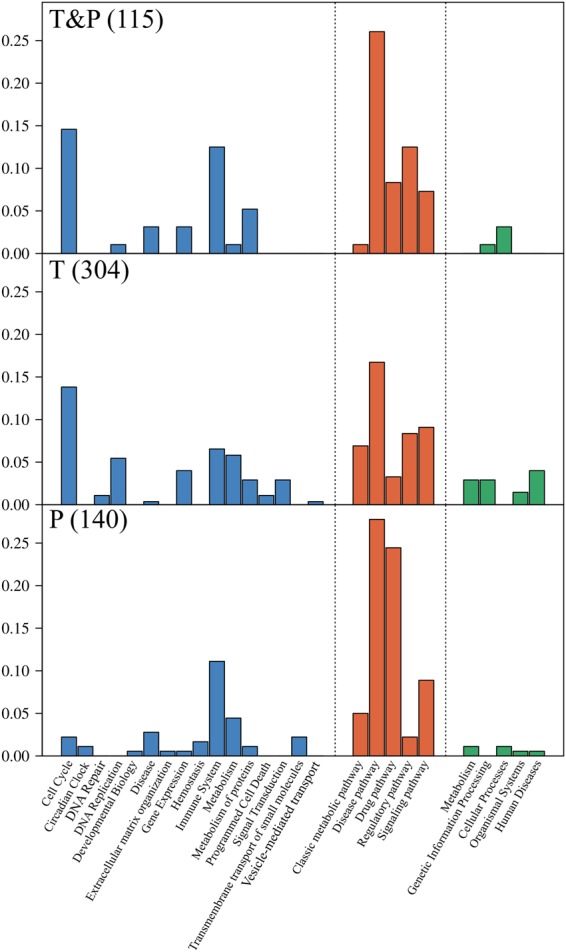
Figure 6.

Histograms showing the normalized distribution probability of pathways identified by transcriptomics alone, proteomics alone, and the combination of transcriptomics and proteomics. The bars show the proportion of each group among the total number of pathway types identified by Reactome (blue), PWO (orange), or KEGG (green). The top panel shows the distribution of the 115 common pathways identified by both transcriptomics and proteomics GSEAs (T&P). The middle panel shows the distribution of the 304 pathways identified only by the transcriptomics GSEA (T). The bottom panel shows the distribution of the 140 pathways identified only by the proteomics GSEA (P). The sum of all the groups in each section is 1.0 for all three panels.
