
Figure 1.
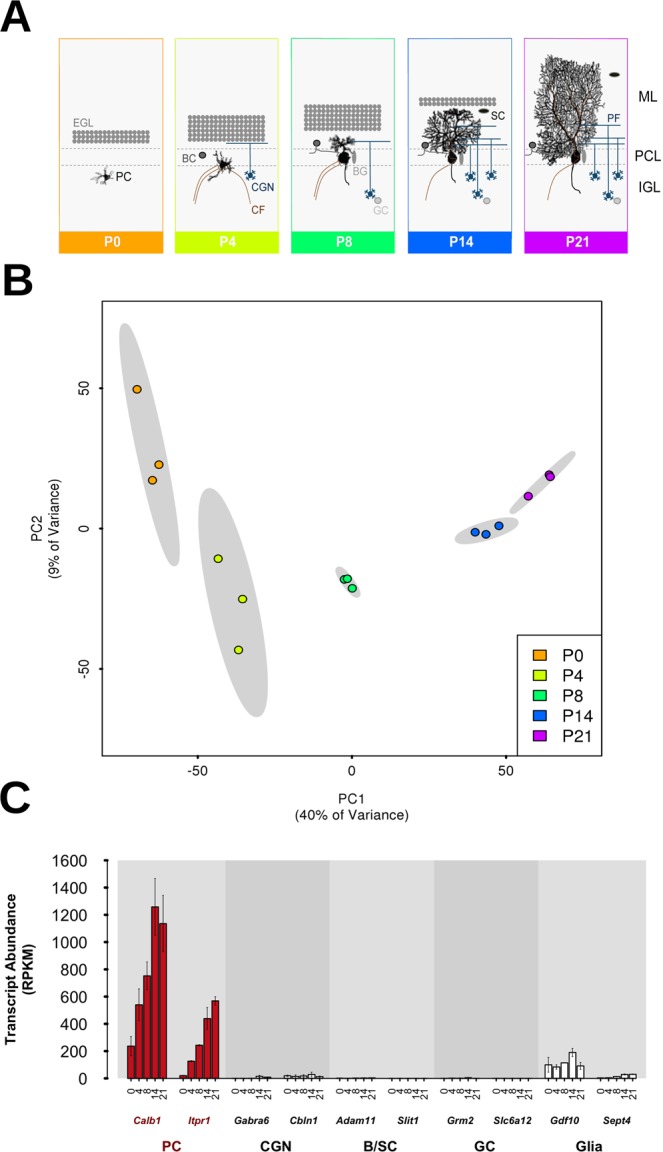
Gene expression data cluster according to developmental time point and confirm successful Purkinje cell (PC) capture. (A) Schematic diagram of mouse PC development from postnatal day 0 (P0) until P21. This developmental period is characterized by extensive morphological changes and the formation of synaptic connections with climbing fibers (CF), Basket cells (BC) and parallel fibers (PF) of cerebellar granule neurons (CGN). BG: Bergmann glia; EGL: external granular layer; GC: Golgi cells; IGL: internal granular layer; ML: molecular layer; PCL: Purkinje cell layer; SC: Stellate cells. (B) PCs were effectively captured at independent developmental stages. Scatter plot of the first two principal components (PC1/2) for all samples, displaying significant groupings according to postnatal day. 95% confidence ellipses for these groups are shaded in grey, displaying full separation. (C) Predominant capture of PC-specific transcripts. Gene expression data (RPKM values) across developmental time points (X-axis) for two cell-specific markers for each cell-type. CGN: cerebellar granule neurons; B/SC: basket/stellate cells; GC: Golgi cells; BG: Bergmann glia. See also Supplementary Fig. S1.