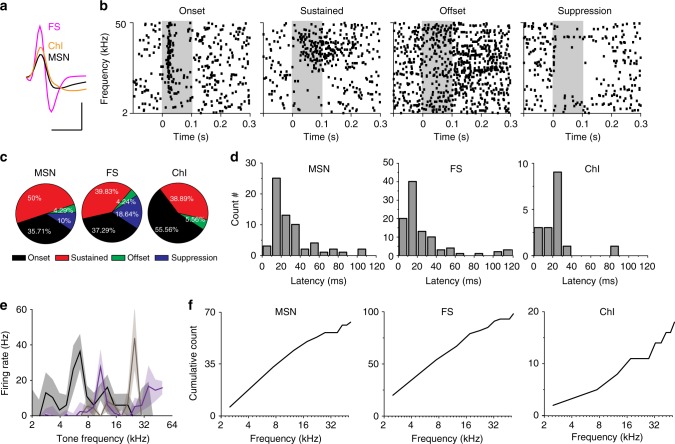
Fig. 2.
Striatal neurons respond to tonal stimuli. a Example of isolated striatal single units for different cell types based on half-valley width of waveforms. Scale bars: 0.5 ms and 50 µV. b Example of striatal sound responses in raster plots. Individual pure tones ranged from 2 to 50 kHz are presented at 0–0.1 s time window (shaded area). c Portion of each type of tonal response for individual striatal cell types. d Distribution of response latency for individual striatal cell types. Latency was calculated as the time point when firing rate is significantly higher than the baseline (average firing rate of 0–50 ms before the onset of tones). e Examples of three tuning plots. Averaged tone-evoked firing rates are plotted against the corresponding tone frequencies. Solid lines: mean values; shaded areas: standard errors. f Accumulative curves of best frequencies for individual striatal cell types. For c–f: MSN, n = 70; FS, n = 118; ChI, n = 18; from 14 mice

