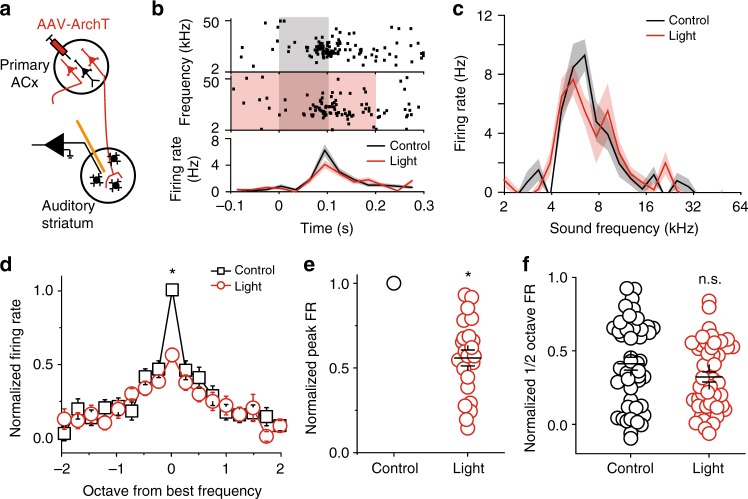
Fig. 4.
Silencing the primary ACx projection to the auditory striatum reduced striatal MSN tonal responses to their best frequencies. a Illustration of recording setup for silencing primary ACx projection. b One example of recorded MSN single unit. Upper panels, raster plots of a MSN firings during tone presentation (gray shaded area) and tone + light presentation (red + gray shaded area). Tone: 0–0.1 s time window; Light: −0.1–0.2 s time window. Lower panel, PSTH of the firing rates in response to tone alone (black) and tone + light (red). c Tuning plots of the example shown in (b). d Average tuning plots at the tone alone (black) and tone + light (red) conditions. Average tuning plots at the tone alone (black) and tone + light (red) conditions. Frequencies are aligned to the best frequency of each single unit and scaled in octave away from the best frequency. The best frequencies are determined separately from control and light-on trials for each single unit. Firing rates at different frequencies of each single unit are normalized to the firing rate at the best frequency from control trials. (e) Normalized individual and averaged firing rates at best frequencies at the tone alone (black) and tone + light (red) conditions. (f) Normalized individual and averaged firing rates at frequencies ± ½ octave away from the best frequency at the tone alone (black) and tone + light (red) conditions. For d–f, n = 22 neurons from five mice, data are presented as mean values, error bars are s.e.m., * p < 0.01, t test in (d) and paired t test in (e and f)

