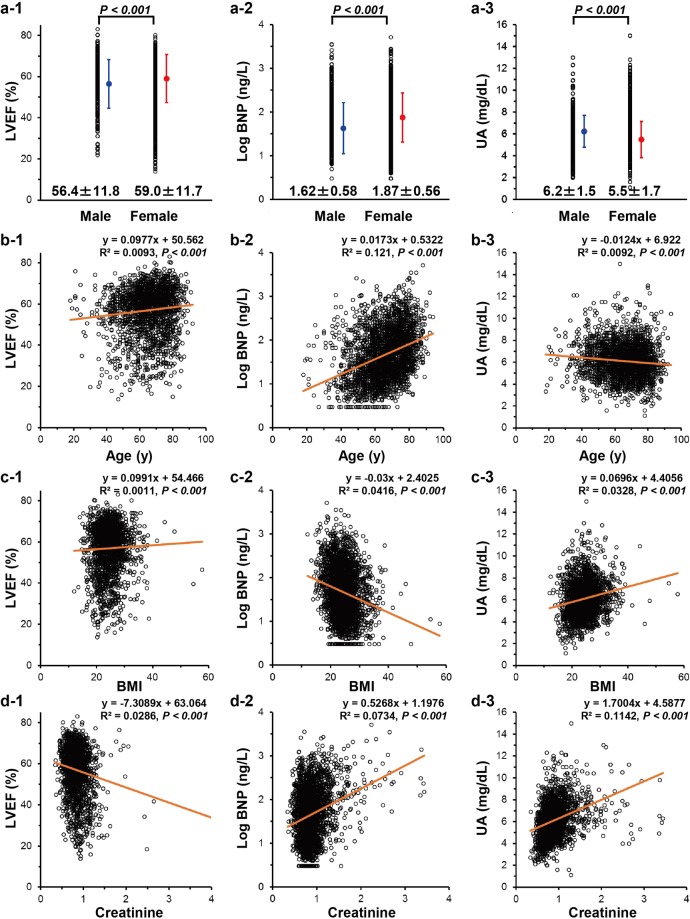
Figure 2.
Single regression analysis among serum UA, plasma BNP, LVEF and other risk factors Scatter plots and a simple regression line (orange straight line) with the regression equation demonstrate the correlation between two values among UA, plasma BNP, LVEF, gender, age, BMI, and creatinine. The means of each value are marked in blue (male) or red (female) plots in each panel, with standard deviations (same colored lines). Statistical significance was indicated as the P value with the horizontal bar in the upper part of each scatter plot in the top three panels. BNP, B-type natriuretic peptide; LVEF, left ventricular ejection fraction; UA, uric acid.

