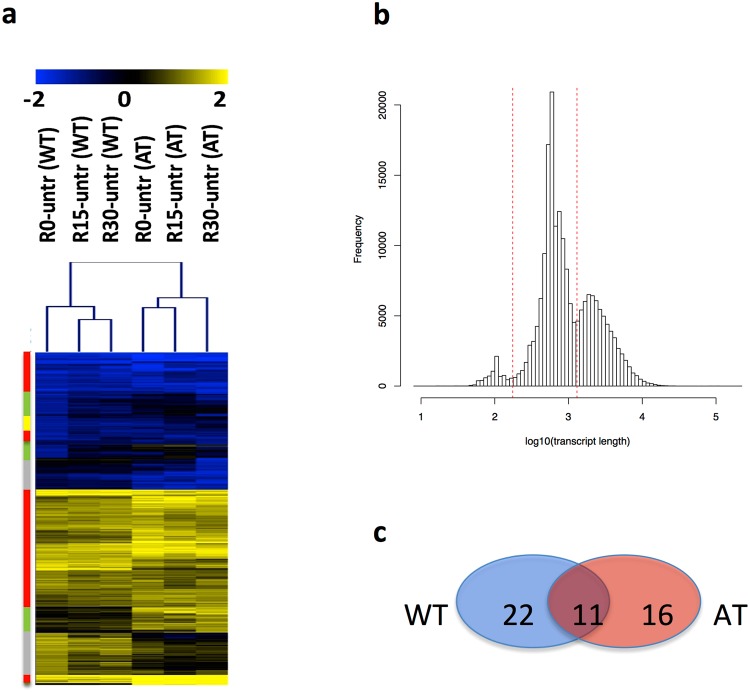
Figure 5.
Hierarchical clustering analysis of differential expression at transcripts and exons level. (a) Log2 expression ratio between CPT treated and untreated cells for the 5666 transcripts detected as differentially expressed in at least one of the two experimental groups, i.e. WT2 and A-T2. (b) ENSEMBL transcripts distribution as function of transcripts’ length. Dashed lines indicate the three groups of transcripts, from left to right, ≤175 nts (7872 transcripts), (ii) >175 nts ≥1300 nts (122719 transcripts) ad (iii) >1300 nts (67307 transcripts). (c) Transcripts showing a Pearson correlation below 0.2, in all replicates, comparing CPT treated vs untreated WT2 and A-T2 neurons.

