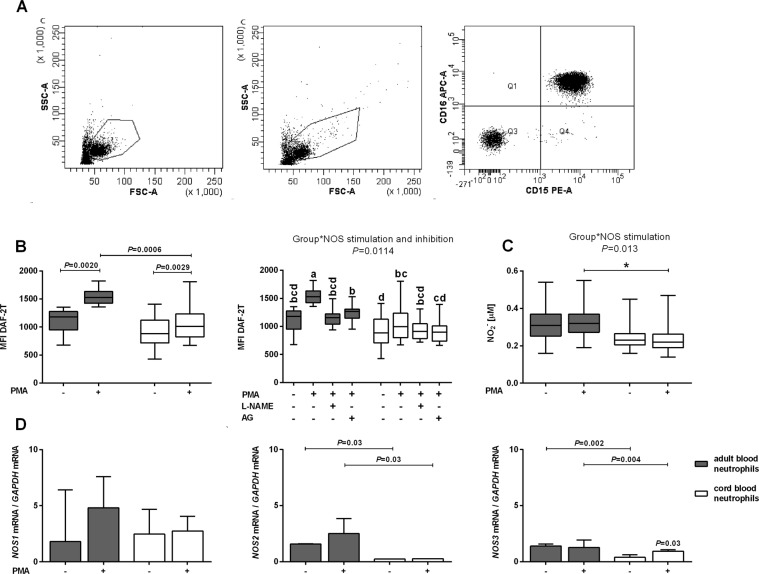
Figure 1.
Cytometric neutrophil identification, nitric oxide (NO) generation and expression of NO synthase (NOS) isoforms in cord (white bars) and adult (gray bars) peripheral blood neutrophils. (A) Representative dot plot of adult (left graph) and cord blood neutrophils (middle graph) identified by forward and side scatter characteristics (FSC and SSC, respectively) and FL-2/FL-4 fluorescence (right graph). Neutrophils were incubated with fluorochrome-conjugated monoclonal antibodies (i.e. anti-CD15–phycoerythrin (PE) and anti-CD16–allophycocyanin (APC)) and gated as FSChigh SSChigh, and CD16highCD15high (Q2 gate; 97.2%). 10 000 events were collected. (B) Intracellular NO production and (C) nitrite concentrations in incubation media of unstimulated and phorbol myristate acetate (PMA)-stimulated cord blood neutrophils (n = 11) and adult blood neutrophils (n = 10). Data are shown as box plots (median, interquartile range and min-max). (B) Intracellular NO production was determined by flow cytometry as described in the Materials and Methods and expressed as mean fluorescence intensity of triazolofluorescein (MFI DAF-2T). Left graph: Data were analysed by Wilcoxon and Mann–Whitney U-tests. Right graph: The functional role of NOS in the intracellular NO generation, as indicated by the graphical representation of a significant interaction between the factors ‘group’ (cord or adult blood neutrophils) and ‘NOS stimulation and inhibition’ (unstimulated neutrophils, PMA-stimulated neutrophils, PMA-stimulated neutrophils incubated with NG-nitro-L-arginine methyl ester (L-NAME) or aminoguanidine (AG)) determined by multifactorial ANOVA/post-hoc Tukey tests. Comparisons are presented using abcd notation - means with the same letter are not significantly different from each other (P > 0.05). Further details are summarized in Table S1. (C) Nitrite concentrations in neutrophil incubation media are shown by graphical representation of significant interactions between the factors ‘group’ (cord or adult blood neutrophils) and ‘NOS stimulation’ (unstimulated neutrophils, PMA-stimulated neutrophils) determined by multifactorial ANOVA/post-hoc Tukey tests, *P < 0.05. Nitrite concentrations were determined using ozone-based chemiluminescence as described in the Materials and Methods. Further details are summarized in Table S2. (D) Median (interquartile range) NOS1, NOS2, NOS3 gene expression in cord (n = 6) and adult blood (n = 6) neutrophils incubated in the absence or presence of 0.97 μM PMA. Total RNA was isolated using TRI-Reagent and NOS1, NOS2, NOS3 expression was evaluated using real-time quantitative polymerase chain reaction. Wilcoxon and Mann–Whitney U-tests.

