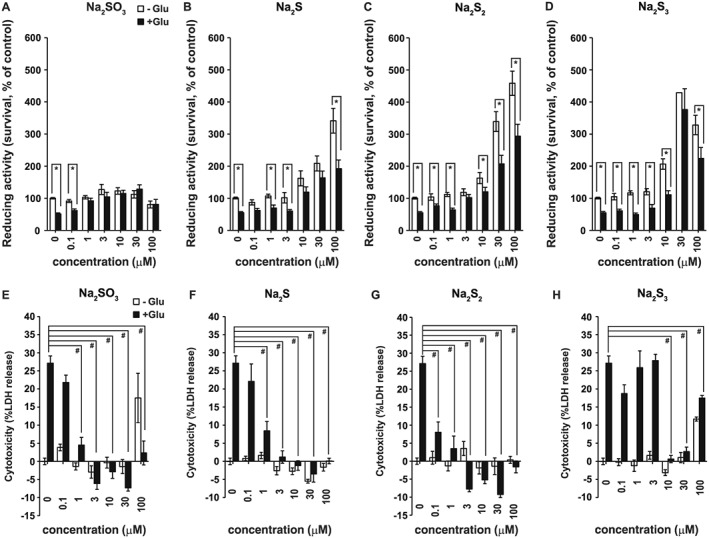
Figure 2.

Comparison of the cytoprotective effect of sulfite, H2S, H2S2 and H2S3. WST‐8 values were shown for primary neuronal cultures 24 h after the addition of 1 mM glutamate (Glu) or without glutamate (−Glu) together with Na2SO3 (A), Na2S (B), Na2S2 (C) and Na2S3 (D) (n = 8). *P < 0.05, as indicated; Student's t‐test. LDH values were shown for primary neuronal cultures 24 h after the addition of 1 mM glutamate (Glu) or no glutamate (−Glu) together with Na2SO3 (E), Na2S (F), Na2S2 (G), and Na2S3 (H) (n = 8). Cytotoxicity [% = (Sample OD490 − low control/ (high control – low control) × 100 showed negative values at higher concentrations of Na2SO3, Na2S, Na2S2, and Na2S3. Low control corresponds to untreated cells used to determine spontaneous LDH release. The negative cytotoxicity % values are caused by the values of samples being lower than the low control value. Even the spontaneous release of LDH was suppressed by Na2SO3, Na2S, NaS2, and Na2S3 possibly due to their cytoprotective effects on cells. All data shown are means ± SEM. In A‐D, *P < 0.05, significantly different as indicated; Tukey−Kramer test. In E‐H, # P < 0.05, significantly different as indicated, for values with glutamate. OD490, optical density at 490 nm.
