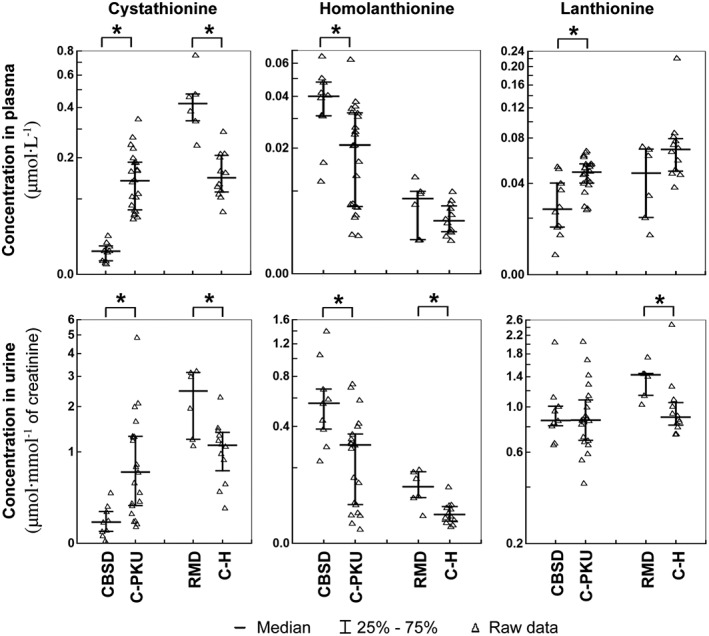
Figure 4.

Concentrations of thioethers in plasma and urine. The left parts of the graphs show distribution of individual data in the group of pyridoxine non‐responsive patients with CBSD (n = 10) who received a protein‐restricted diet with amino acid supplements enriched with Cys, and the appropriate control group of patients on low protein/amino acid mixture‐supplemented diet suffering from classical phenylketonuria (C‐PKU, n = 22). The right parts of the figures show data from patients with RMD (n = 6) and healthy controls (C‐H, n = 12). Solid bars indicate medians, whiskers represent the first and the third quartile, and asterisks denote significant difference between patients and the respective controls.
