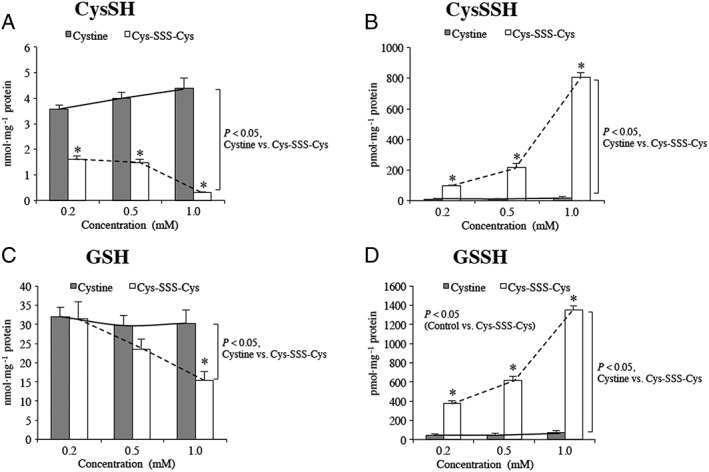
Figure 5.

RSH and RSSH levels in HEK293T cells pretreated with either cystine (Cys‐SS‐Cys) or cysteine trisulfide (Cys‐SSS‐Cys). (A) Cysteine levels resulting from pretreatment with Cys‐SS‐Cys or Cys‐SSS‐Cys; (B) Cysteine hydropersulfide (Cys‐SSH) levels in cells pretreated with Cys‐SS‐Cys or Cys‐SSS‐Cys; (C) GSH levels in cells pretreated with Cys‐SS‐Cys or Cys‐SSS‐Cys and (D) GSSH levels in cells pretreated with Cys‐SS‐Cys or Cys‐SSS‐Cys. Each experiment was carried out 5 separate times (each time in triplicate). For each experiment, the values from the triplicates were averaged to give a single value. Data represent average ± SD (n = 5), * P < 0.05. Statistical analysis was performed as described in the Methods section.
