Figure 4.
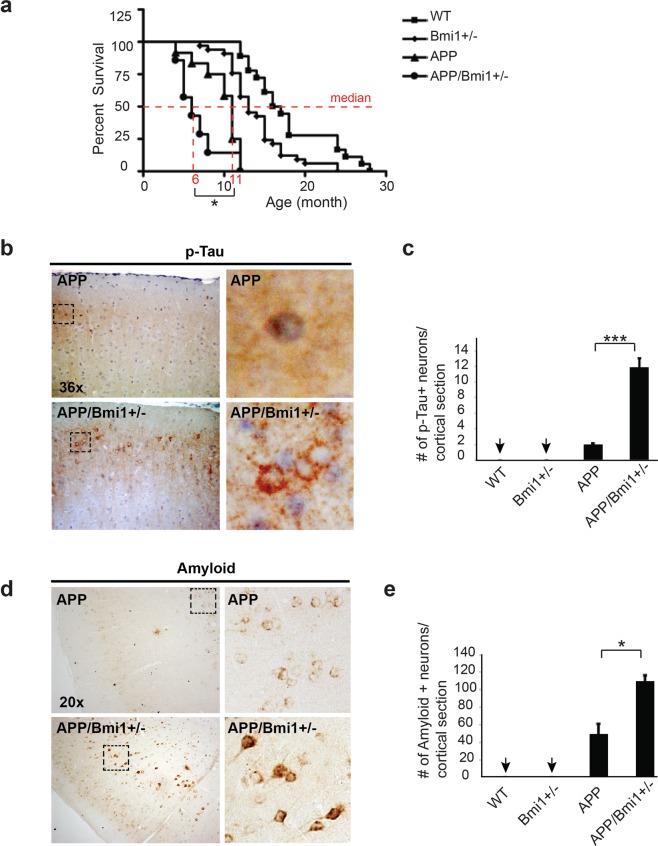
APP/Bmi1+/− mice show genetic cooperation in disease onset and severity. (a) Kaplan-Meyer representation of the survival curves of WT (n = 11), Bmi1+/− (n = 13), APP (n = 6) and APP/Bmi1+/− (n = 6) mice. (b) IHC staining for p-Tau (PHF1) on cortical sections of 6 month-old WT (n = 3), Bmi1+/− (n = 3), APP (n = 3),and APP/Bmi1+/− (n = 3) mice. Scale bar: 20μm. Scale bar in the inset: 8μm. (c) Quantification of p-Tau-positive neurons shown in (b). (d) IHC for amyloid (DE2B4) on cortical sections of 6-month old WT (n = 3), Bmi1+/− (n = 3), APP (n = 3), and APP/Bmi1+/− (n = 3) mice. Scale bar: 20μm. (e) Quantification of amyloid-positive cells shown in (d). Values are mean ± SEM. *P < 0.05; (**) < 0.01; (***) < 0.001; Student’s t-test.

