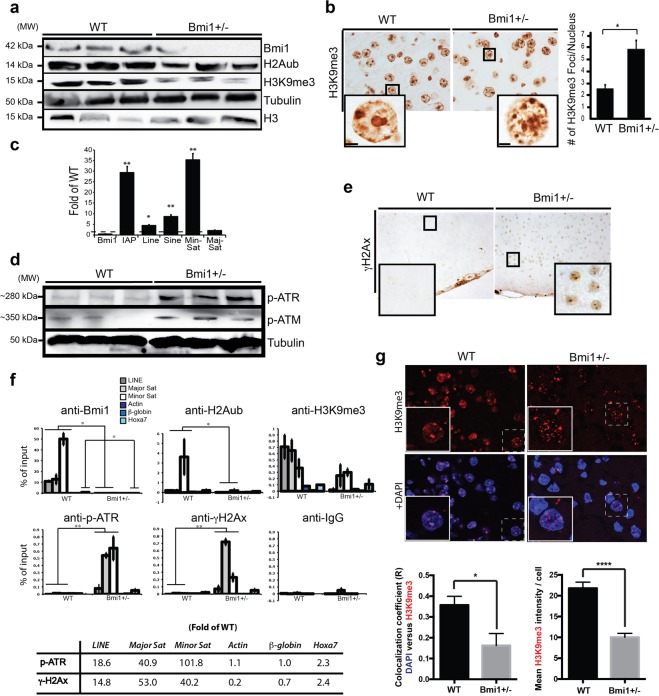
Figure 5.
Loss of heterochromatin and DDR in cortical neurons of Bmi1+/− mice. (a) Western blot analysis of cortical extracts from old WT (n = 6) and Bmi1+/− (n = 6) mice. (b) IHC on cortical sections from old WT (n = 3) and Bmi1+/− (n = 3) mice with quantification of the number of H3K9me3 foci per nucleus (6 sections/sample were counted). Scale bar in the inset: 3μm. (c) Real-time RT-PCR analysis for the expression of satellite repeats in cortices from WT (n = 3) and Bmi1+/− (n = 3) mice. (d) Western blot analysis of cortical extracts from old WT (n = 3) and Bmi1+/− (n = 3) mice. (e) IHC for γH2AX on cortical sections of old WT and Bmi1+/− mice. (f) ChIP analyses were performed on frontal cortex homogenates from 15 month-old WT (n = 3) and Bmi1+/− (n = 3) mice. Quantitative PCR was performed in triplicate for each DNA sequence. All data are presented as fold of input. Bmi1 and H2Aub reduction (p < 0.05), and p-ATR and γH2AX accumulation (p < 0.01) in Bmi1+/− mice are significant (Two-way ANOVA analysis). (bottom panel) Fold differences for γH2AX and p-ATR accumulation in Bmi1+/− mice were measured relative to WT levels for each DNA sequences. (g) Cortical slices from 45-day old mice. Areas showed are located in layers 2-3 of the frontal cortex. In WT samples, large pyramidal neurons were strongly labeled by the H3K9me3 antibody and H3K9me3 co-localized with DAPI. In Bmi1+/− samples, large pyramidal neurons were weakly labeled by the H3K9me3 antibody and the H3K9me3 signal was fragmented. Bottom panels: Quantification of the images showed in (f). Values are mean ± SEM. *P < 0.05; **P < 0.01; ****P < 0.0001; Student’s t-test.

