Figure 7.
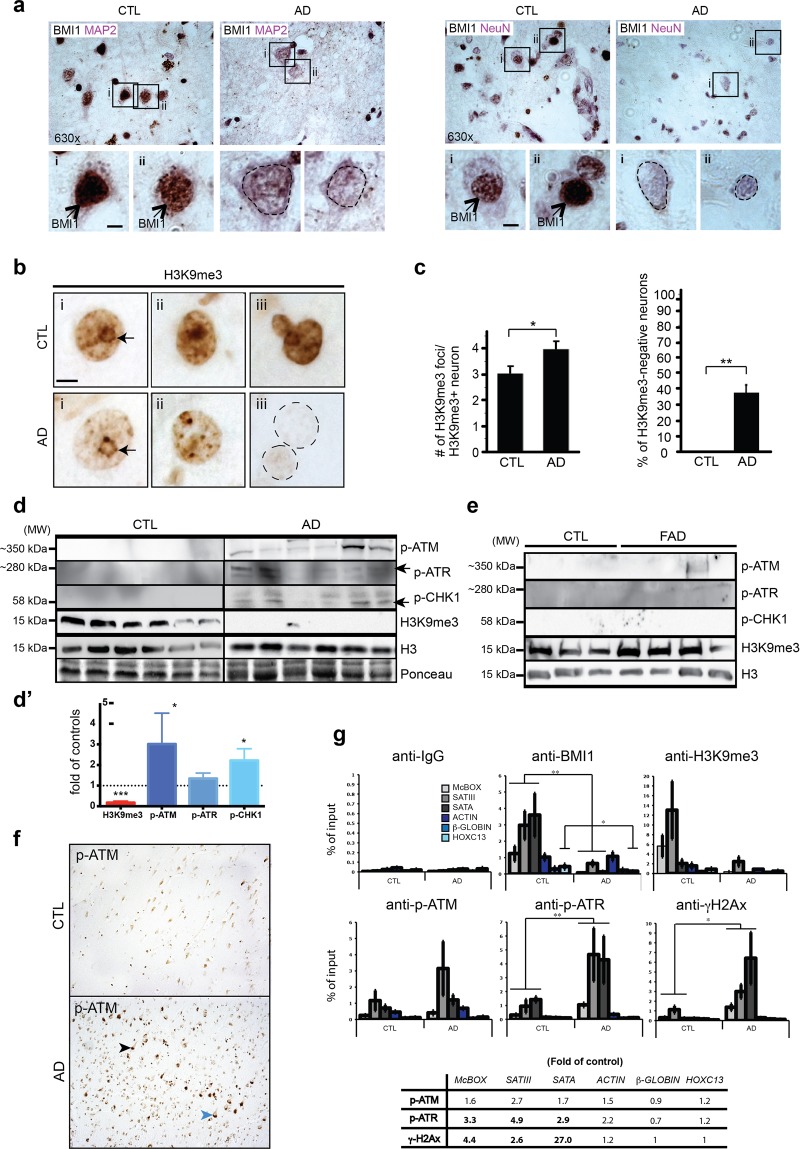
Loss of heterochromatin and DDR in AD brains. (a) IHC staining for BMI1 (brown staining-black arrows) and MAP2 or NeuN (violet staining) on paraffin sections from the frontal cortex of age-match control (n = 2) and AD (n = 2) patients. Weak nuclear staining for BMI1 (dash lines) was observed in AD neurons. Scale bar: 3μm. (b) IHC staining for H3K9me3 on frontal cortex sections of control (n = 5) and AD (n = 5) brains: (i) reduced peri-nucleolar heterochromatin in AD (arrows), (ii) chromocenters de-condensation in AD, and (iii) loss of H3K9me3 immunoreactivity in AD neurons (dash lines). Scale bar: 5μm. (c) Quantification of data in (b) showing the number of H3K9me3 foci/H3K9me3-positive neuron. H3K9me3-negative neurons were excluded from the analysis. Quantification of the number of H3K9me3-negative neurons, which were not found in aged controls. 6 full-fields at 630 magnification/sample were counted. Values are mean ± SEM. *P < 0.05; (**) < 0.01; Student’s t-test. (d) Immunoblot using extracts from the frontal cortex of age-match control and AD patients. (d’) Quantification of the results showed in (d). (e) Immunoblot using extracts from the hippocampus of age-match control and FAD patients. (f) IHC staining for p-ATM on paraffin sections from the frontal cortex of age-match control (n = 2) and AD (n = 2) patients. p-ATM is predominant in AD neurons and accumulates in both cytosolic (blue arrowhead) and nuclear (black arrowhead) compartments. (g) ChIP experiments were performed on frontal cortex extracts of age-match control (n = 6) and AD brains (n = 6). All data are represented as fold of input. (A) Note BMI1 and H3K9me3 enrichment at McBOX, SATIII and SATA in control samples. BMI1 was also found at HOXC13. BMI1 and H3K9me3 were depleted at all loci in AD samples (bottom). Fold differences between control and AD samples for p-ATM, p-ATR and γH2AX accumulation. Values are mean ± SEM. *P < 0.05; **P < 0.01; ***P < 0.001; Two way-ANOVA test was performed for multiple gene analysis and Student’s t-test for single gene analysis.

