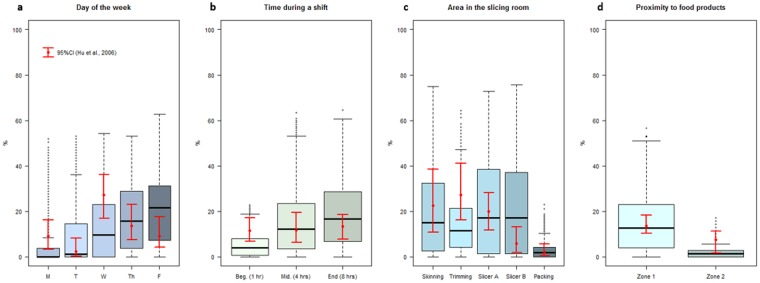
Figure 3.
Validation of EnABLe with historical data. Boxplots show model simulation results as the median (black bar), interquartile range (box), 5th–95th percentile (black whiskers), and outliers (black points outside of whiskers). The point and whiskers in red represent the observed prevalence and 95% confidence interval (CI)22. The model is compared to observed outcomes for Listeria spp. prevalence by (a) day of the week (Monday-Friday); (b) the time during a shift; (c) area of the slicing room; and (d) between Zone 1 and Zone 2 surfaces. Absence of significant differences between observed prevalence and mean simulated prevalence indicated model fit (Table S3).

