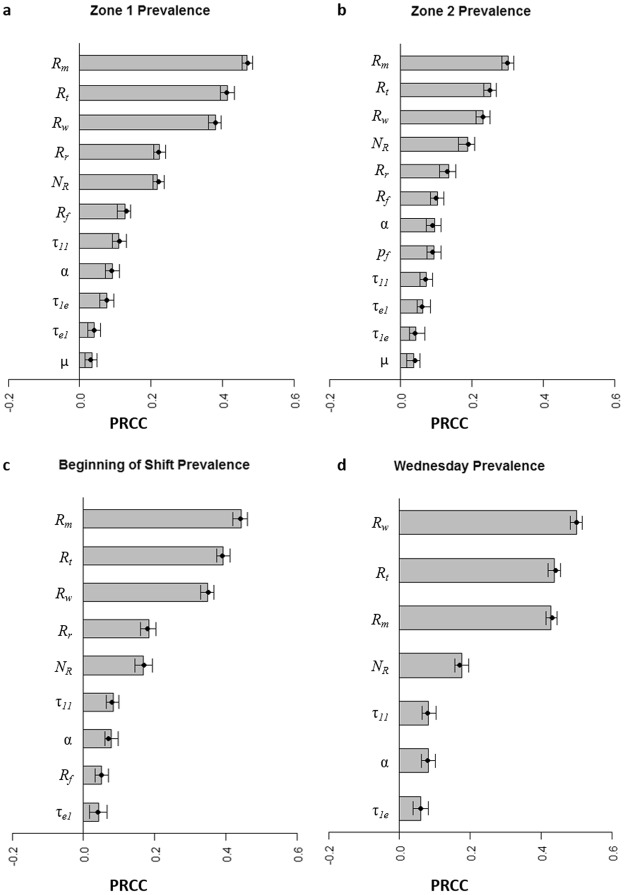
Figure 4.
Key EnABLe parameters impacting Listeria spp. (LS) prevalence outcomes used in model validation: (a) Zone 1 surfaces, (b) Zone 2 surfaces, (c) At the beginning of the shift, and (d) on Wednesday. Tornado plots show Partial rank correlation coefficients (PRCC) and 95% confidence intervals for significant input parameters after Bonferroni correction. Rm, prevalence of LS in cold-smoked salmon fillets on Monday; Rt, prevalence of LS in cold-smoked salmon fillets on Tuesday; Rw, prevalence of LS in cold-smoked salmon fillets on Wednesday; Rr, prevalence of LS in cold-smoked salmon fillets on Thursday; Rf, prevalence of LS in cold-smoked salmon fillets on Friday; NR, concentration (CFU/g) of LS per contaminated cold-smoked salmon fillet; α, proportion of LS transferred to an equipment surface upon contact with a contaminated cold-smoked salmon fillet; τ11, probability of LS transfer from Zone 1 to Zone 1 given contact; τ1e, probability of LS transfer from Zone 1 to an employee given contact; τe1, probability of LS transfer from an employee to Zone 1 given contact; pf, probability that a cold-smoked salmon fillet falls to the floor during production; μ, growth rate (h−1) of LS on environment surfaces.

