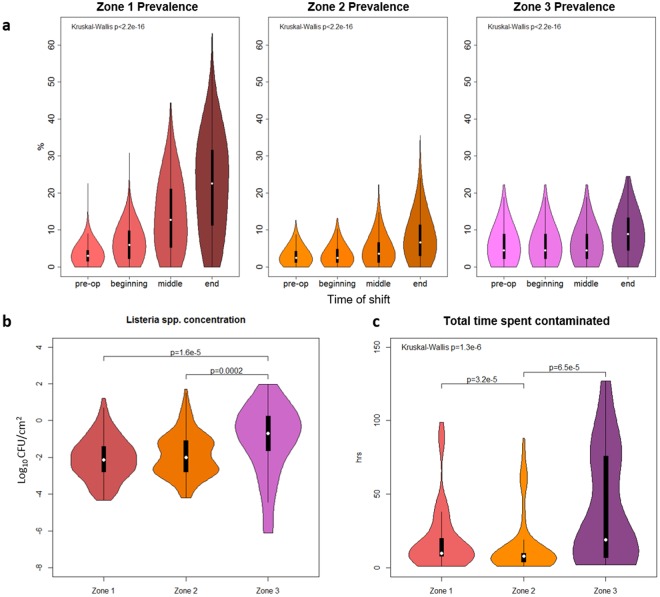
Figure 5.
Listeria spp. (LS) dynamics on different surface types (characterized by their proximity to food products, with Zone 1 being in contact, and Zone 2 and Zone 3 being non-contact) in the cold-smoked salmon slicing room. (a) Simulation results for percent of sites contaminated over time of the shift on Friday are shown as violin plots, with the central white dot representing the median value, the black bar representing the interquartile range (IQR), the black line representing 95% confidence interval, and the outer shape representing the kernel density plot of all possible values (the thickest section indicates the mode). Mean LS prevalence differed significantly among slicing room surfaces from beginning to end of a production shift across all zone categories (P < 2.2e-16). (b) Simulation results for the concentration on Zone 1, 2, and 3 surfaces (Log10 CFU/cm2), if contaminated at the middle of the shift on Friday, shown as violin plots. The concentrations (described with median [5th and 95th percentile]) of LS on Zone 1 (−2.1 [−3.9, −0.05] Log10 CFU/cm2) and Zone 2 surfaces (−2.0 [−3.8, 0.15] Log10 CFU/cm2) were significantly different from Zone 3 (−0.7 [−5.7, 1.1] Log10 CFU/cm2) for this time point. (c) Violin plot of the total time (hours) spent contaminated by zone over one-week simulations. Total time contaminated described with median [5th and 95th percentile]) was significantly different across zone categories (P = 1.3e−6). Zone 1 and Zone 2 agents were contaminated for a cumulative of 10 hours [2.0, 87] and 8 hours [2.0, 62] over the simulated week, respectively, while Zone 3 sites were contaminated for a cumulative of 19 hrs [2.0, 113].

