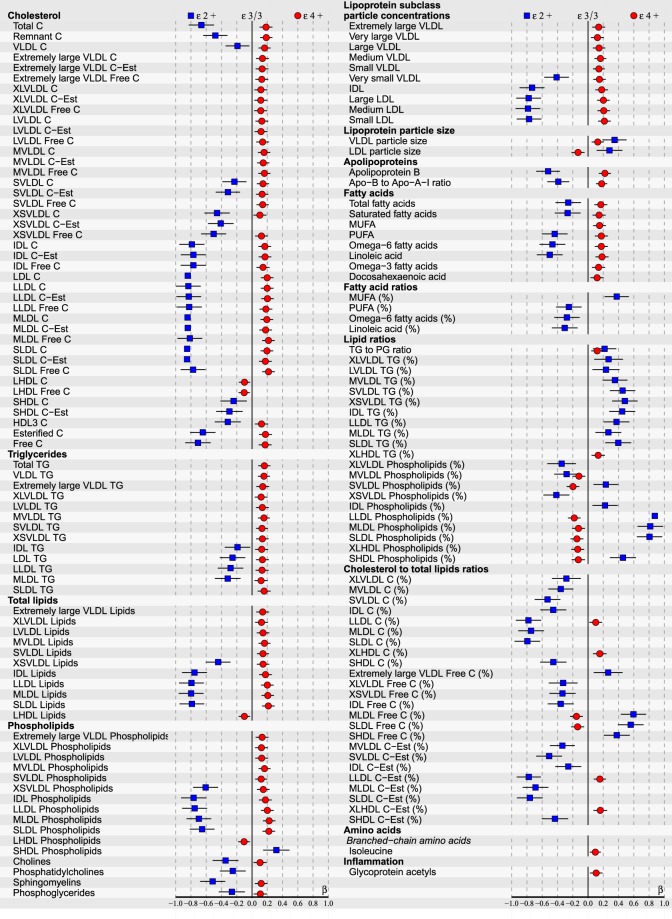
Figure 1.
ApoE effects on 154/228 (p < 0.05 after false discovery rate correction) NMR-based serum metabolic measures in all subjects (n = 2234) of YFS cohort participated in 2001. Statistics: Regression models are adjusted for age, BMI and sex. Regression β-coefficients (x-axis) indicate in standard deviation (SD) units the change in metabolite level over apoE genotype subgroups (ε2+, ε3/3, ε4+). The most common ε3/3 subgroup (n = 1280) is set at the origin (zero SD) and post-hoc compared with ε2+ (squares) and ε4+ subgroups (circles). β-values with 95% CI are scaled to SD increments from normalized i.e., ln-transformed metabolic measures. For clarity of illustration, only the results of the analyses with p < 0.05 after false discovery rate correction are shown here. Definitions: apoE ε2+ subgroup (ε2/2, ε3/2 combined; n = 146) and apoE ε4+ subgroup (ε4/2, ε4/3, ε4/4 combined; n = 808).

