
FIG 5.
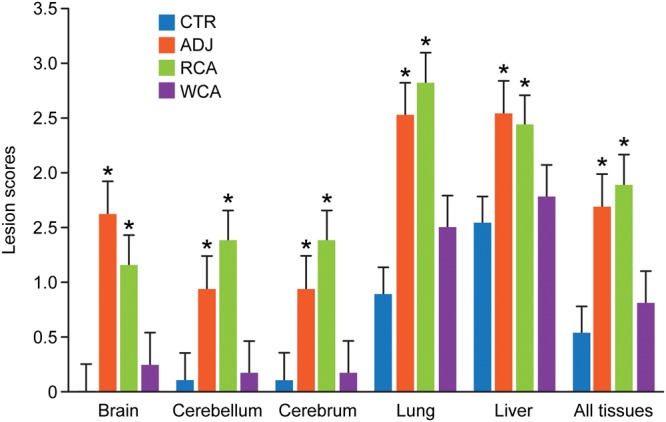
Histopathological grading scores for individual tissues and for the combined average values for all tissues. Histopathological observations of tissue samples from each dog with assigned numerical scores are presented. Bars represent mean scores ± standard deviations (SD) within each group. Asterisks above each bar refer to significant changes (P < 0.05) observed relative to the uninfected controls (CTR).