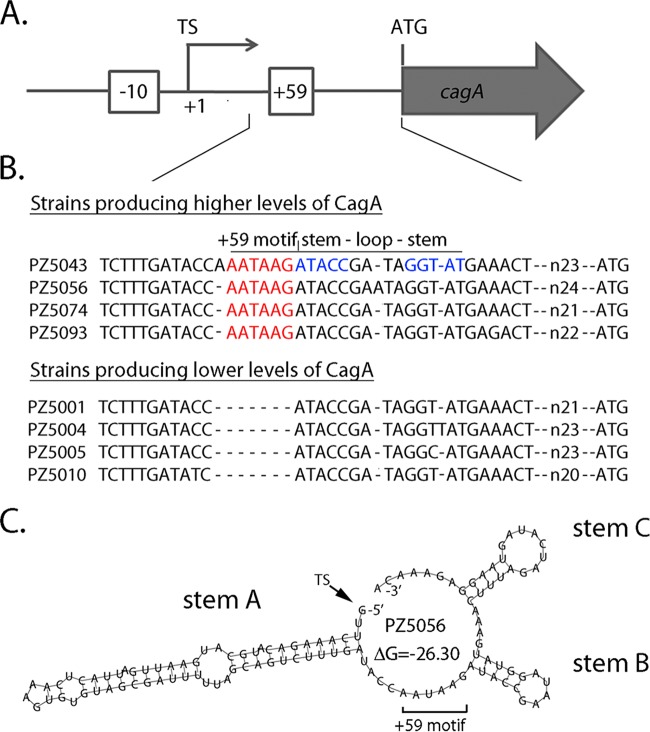
FIG 1.
Schematic depicting a strain-specific +59 AATAAG motif in the cagA 5′ UTR. (A) Features upstream from cagA are illustrated. Numbering is based on designation of the cagA transcriptional start site (TS) as position +1. The +59 AATAAG sequence is located downstream of the cagA transcriptional start site and upstream from the cagA ATG start codon. The −10 sequence of the cagA promoter is also illustrated. (B) ClustalW analysis depicts naturally occurring diversity in the +59 region of 4 wild-type Colombian H. pylori strains that produce high levels of CagA and 4 wild-type Colombian strains that produce low levels of CagA (23). (C) RNAfold with default parameters (26) was used to analyze the secondary structure of the cagA 5′ UTR of strain PZ5056, which produces high levels of CagA (23). The region analyzed begins at the cagA transcriptional start site and ends at the nucleotide before the ATG translational start site. A minimum free energy (ΔG) value of −26.3 was predicted by RNAfold for the WT structure. Three predicted stem-loop structures (labeled stem A, stem B, and stem C) are similar to those predicted for the reference strains in Fig. S1 in the supplemental material.

