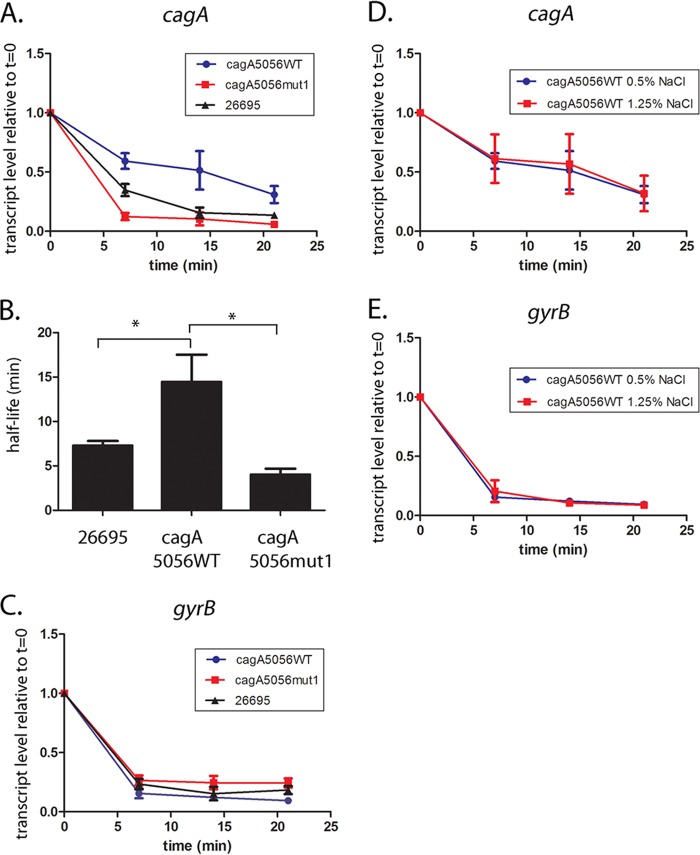
FIG 3.
The mut1 mutation affects cagA transcript stability. Overnight cultures were subcultured into fresh medium (starting OD600, 0.2) and cultured for 6 h. To inhibit transcription, rifampin (80 μg/ml; Sigma‐Aldrich) was added to each culture. Aliquots of the cultures were collected at the baseline (time zero [t = 0]) and 7, 14, or 21 min after addition of rifampin. Samples were transferred to the RNAlater Bacteria reagent (Qiagen) and stored at −80°C. RNA extraction, cDNA synthesis, and real-time PCR were performed as described in Materials and Methods. The H. pylori strains used in the analysis included wild-type strain H. pylori 26695 and H. pylori 26695 strains in which the endogenous sequences upstream from cagA were replaced with the corresponding sequences from strain PZ5056 (26695-cagA5056WT or 26695-cagA5056mut1). (A to C) The H. pylori strains were cultured in medium containing 0.5% sodium chloride. (A) cagA transcript levels were normalized to those of 16S rRNA, and the respective normalized 16S rRNA values were compared to the normalized cagA values of the same cultures that did not receive rifampin treatment (i.e., the values at time zero). The y axis represents the relative cagA transcript level for each strain at the given time points after rifampin addition. (B) The data from panel A were used to plot a cagA transcript decay curve, and cagA transcript half-lives were calculated (see Materials and Methods). A one‐way analysis of variance with Dunnett’s multiple comparison was used to analyze statistical significance (*, P < 0.05). (C) Analysis of the same samples for gyrB expression. (D, E) Relative cagA and gyrB transcript levels at serial time points after addition of rifampin in H. pylori 26695 containing cagA5056WT sequences grown in medium containing 0.5% NaCl or 1.25% NaCl. All data points represent the results from analysis of at least 4 independent biological samples. For all experiments, the mean ± SEM is shown.

