FIG 5.

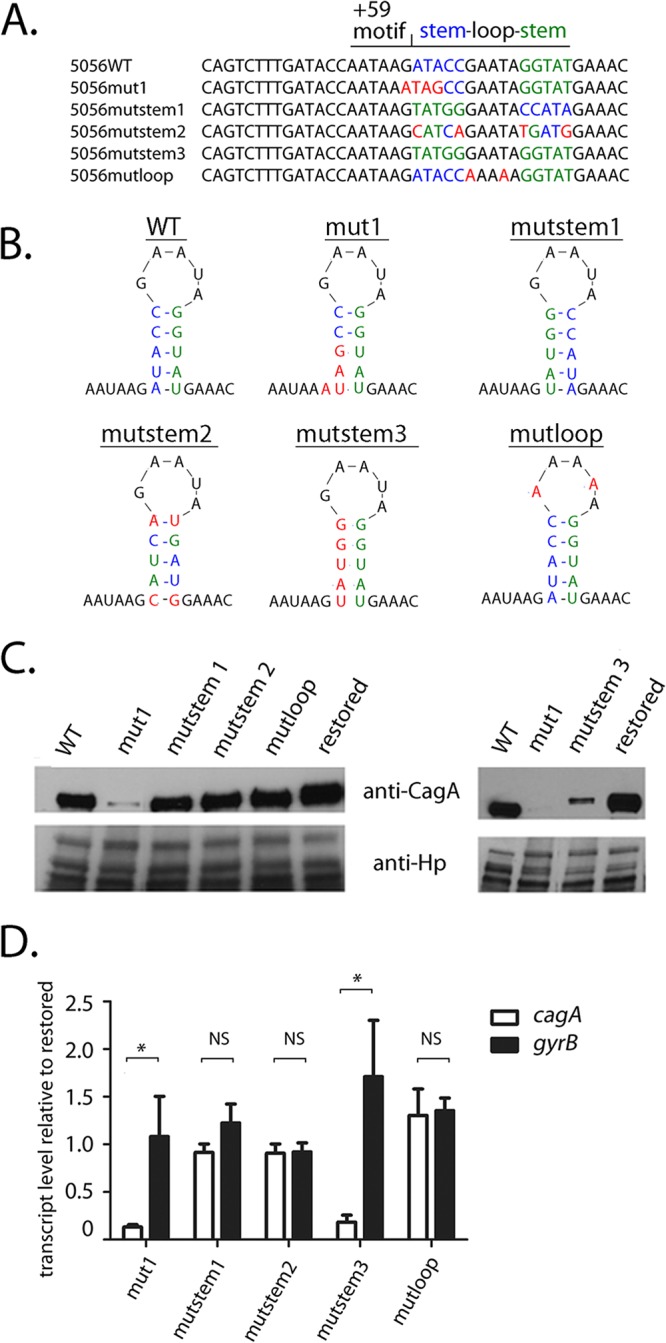
Mutations in stem B affect cagA expression in H. pylori strain PZ5056. Mutations were introduced into the nucleotide sequences corresponding to stem B in strain PZ5056. In addition, sequences containing a wild-type stem-loop B were reintroduced into strain PZ5056 (i.e., restored), which served as a control. (A, B) The nucleotides forming the upstream portion of stem B in WT strain 5056 are shown in blue, while the nucleotides forming the downstream end of stem B are shown in green. Shown in red are nucleotide changes that alter the nucleotide composition of either the upstream stem, the downstream stem, or the loop portions of stem B. (A) In mutstem1, the upstream stem-forming nucleotide sequences were switched with those of the downstream stem-forming sequences. In mutstem 2, compensatory nucleotide changes were introduced into the downstream bases to allow for base pairing with nucleotide changes that had been introduced into the upstream stem-forming sequences. In mutstem3, the nucleotide sequences of the upstream stem were altered to be identical to the nucleotide sequences of the downstream stem, thus resulting in the loss of base pairing of stem B. In mutloop, the nucleotides forming the loop portion of stem B were altered from GAATA to AAAAA. (B) The sites of mutations relative to the predicted stem B structure. (C) Western blot analysis of CagA in the H. pylori PZ5056 strain and the mutant strains was performed as described in Materials and Methods. (D) The transcription of cagA and gyrB was analyzed by real-time PCR, which was performed as described in the Materials and Methods. For each sample, the cagA and gyrB signals were first normalized to the 16S rRNA signal. A relative transcription value was next calculated by dividing the normalized cagA or gyrB values for each sample by the corresponding normalized value for the restored PZ5056 strain. All data points represent the results from analyses of at least 4 independent biological samples. The mean ± SEM is shown. Statistical analysis was conducted using the Mann-Whitney test. Significant differences are shown (*, P < 0.05; NS, not statistically significant).
