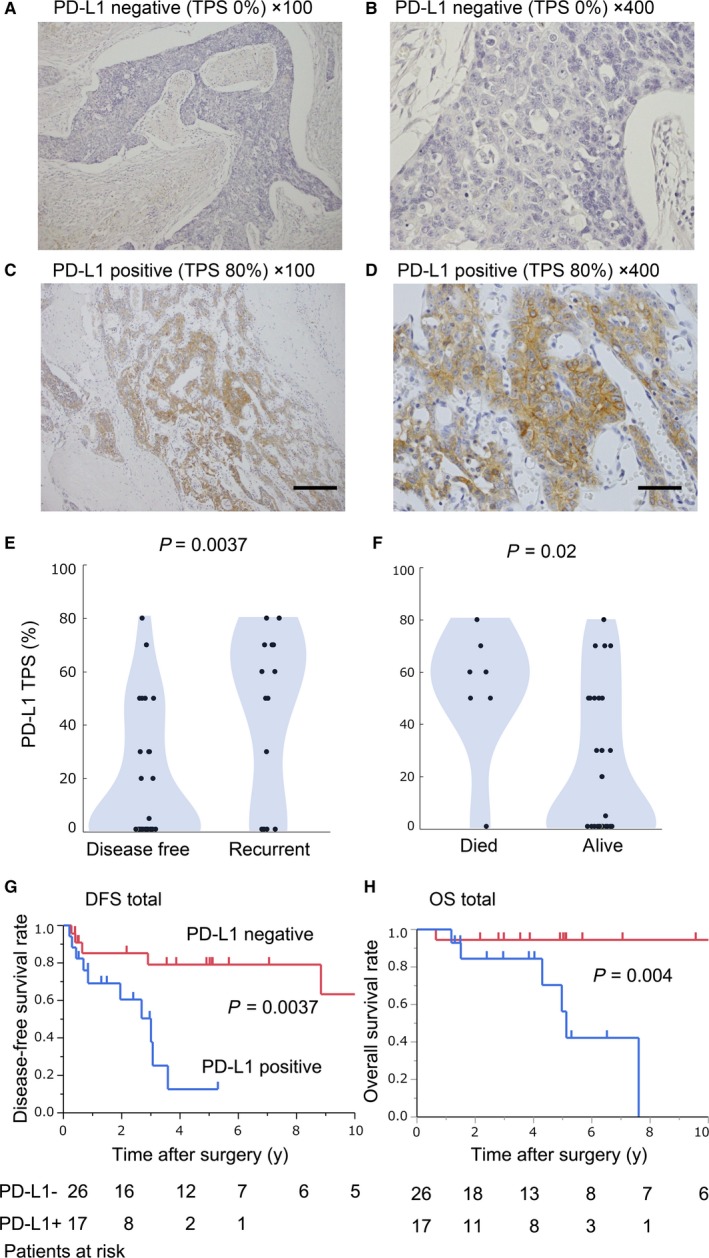
Figure 1.

Immunohistochemical staining of PD‐L1 and the clinical impact. Representative images of IHC staining for PD‐L1 in a resected tumor from a patient with thymic carcinoma. (A‐B) PD‐L1‐negative staining (Tumor proportion score; TPS 0% A; ×100, B; ×400) and PD‐L1‐positive staining (TPS 80%, C; ×100, D; ×400). Scale bars (×100); 200 µm, Scale bar (×400); 50 µm. Panels E and F show dot plots depicting PD‐L1 TPS according to the clinical outcome. Panels G and H show disease‐free survival (DFS) and overall survival (OS) based on PD‐L1 status (G; DFS, P = 0.0037, H; OS, P = 0.04)
