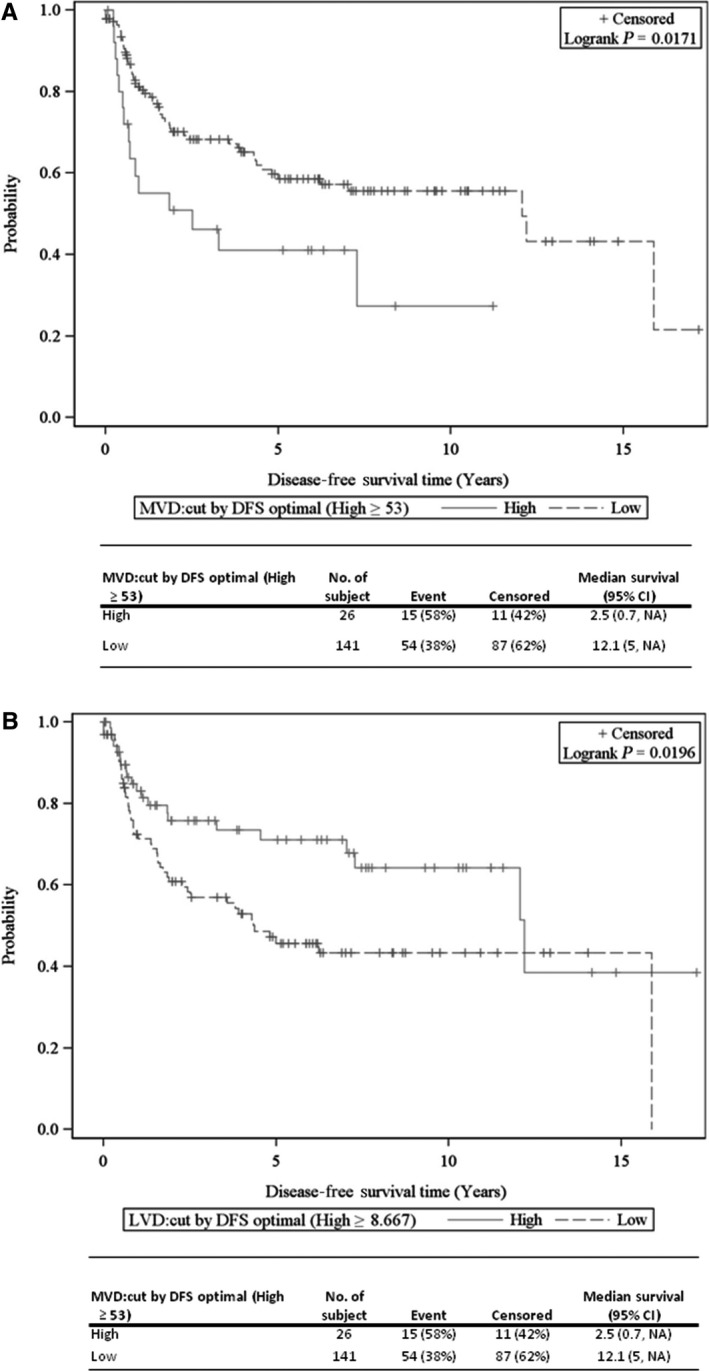
Figure 3.

KM curves of disease‐free survival (DFS) for the studied biomarkers. A, MVD effect on DFS determined by an optimal cut‐point driven by DFS analysis (High ≥ 53). B, LVD effect on DFS determined by an optimal cut‐point driven by DFS analysis (High ≥ 8.667).
