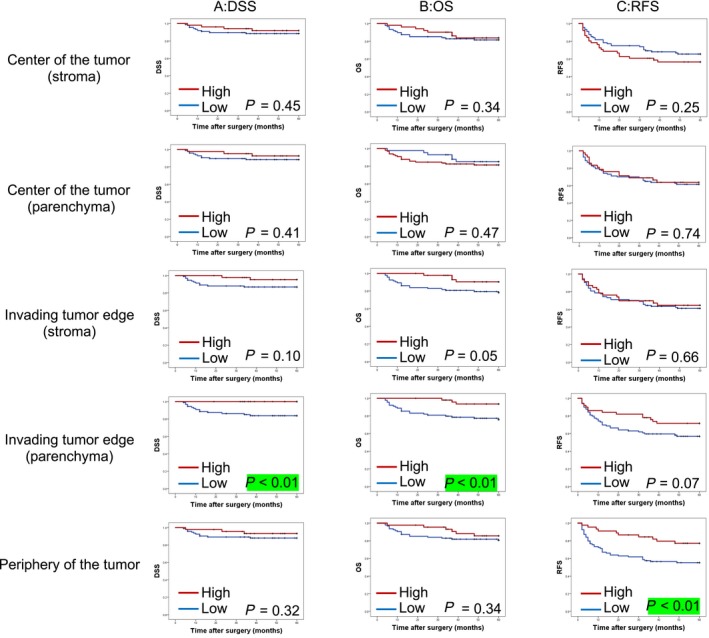
Figure 4.

Prognostic role of tumor‐infiltrating CD8+ T cells in the outcome of patients with oral squamous cell carcinoma after definitive surgery by density of CD8+ T cells. A, Kaplan‐Meier curves for disease‐specific survival (DSS) by location of CD8+ T cell density. B, Kaplan‐Meier curves for overall survival (OS) by location of CD8+ T‐cell density. (C) Kaplan‐Meier curves for recurrence‐free survival (RFS) by location of CD8+ T‐cell density. The red line indicates high CD8+ T‐cell density and blue line indicates low CD8+ T‐cell density
