
Figure 2.
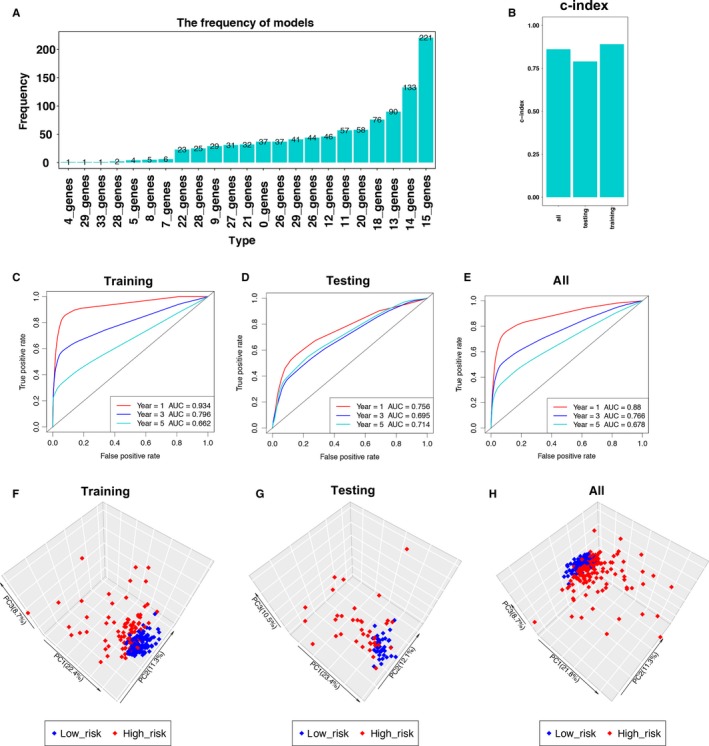
Construction and validation of the immune‐related risk signature. A, Results of elastic net. After 1000 iterations, there were 23 gene groups, of which 15 immune‐related genes were significantly higher frequency than other gene groups. B, The c‐indexes for training, testing, and total cohort were 0.891, 0.790, and 0.861, respectively. C‐E, Time‐dependent ROC curve analysis of the signature in training set, testing set, and all set. 1‐year AUC, 3‐year AUC, and 5‐year AUC in training set, testing set, and all set is 0.934, 0.756, 0.88, 0.796, 0.695, 0.766, 0.662, 0.714, and 0.678, respectively. F‐H, Principal component analysis of the training, testing, and total KIRP cohort with the 15‐immune‐related gene expression. The high‐risk patients were marked by red dots, and the low‐risk patients were marked by blue dots