
Figure 4.
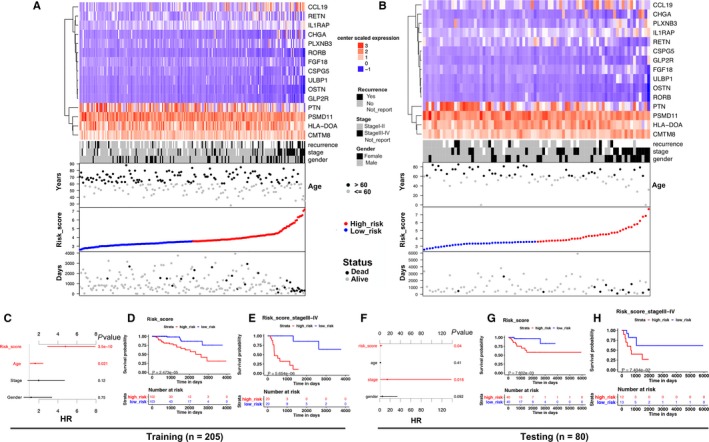
15 immune‐related gene predictor‐score analysis of KIRP patients in both the training and testing cohorts. A and B, Heatmap showed the 15‐immune‐related gene expression distribution in training, testing cohorts. Each column represented the same patient corresponded to the below point showing risk score distribution, survival status, and time in KIRP patients. Each point represented one patient sorted by the rank of the risk score. Red, blue, black, and gray represented patient high risk, low risk, dead, and alive, respectively. The patients in female, advanced stage, and tumor recurrence showed high‐risk score. C and F, The multivariate Cox analysis in training and testing cohorts. The 15 immune‐related genes signature was able to serve as an independent prognostic factor for OS. D and G, The survival analysis in training and testing cohorts without stratification. Survival curve showed that patients with high‐risk score were correlated with a trend toward worse survival outcomes. E and H, The survival analysis in stage III‐IV patients in training and testing cohorts. Survival curve showed that patients with high‐risk score were correlated with a trend toward worse survival outcomes