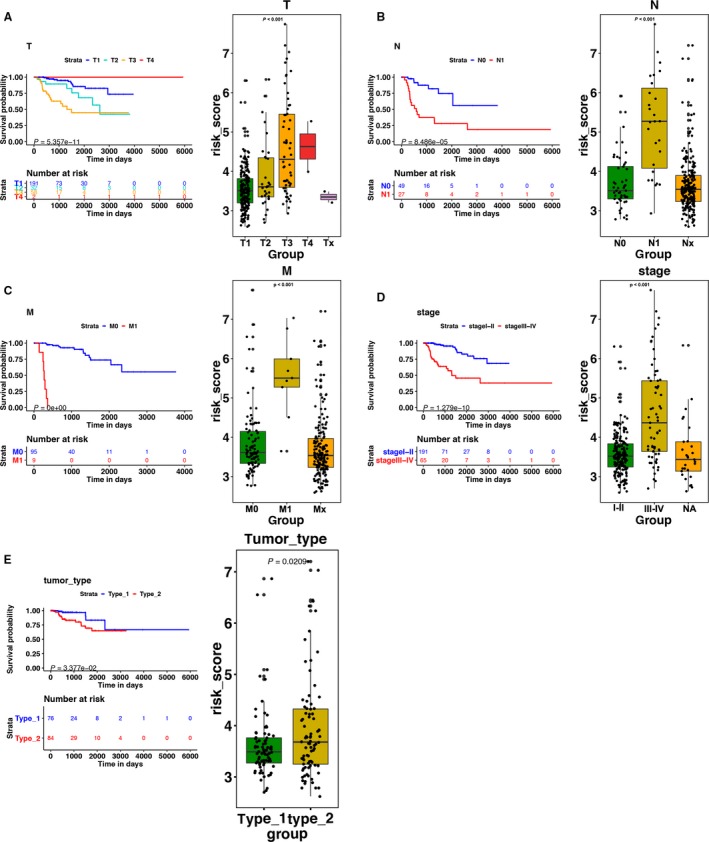
Figure 6.

(Left)The K‐M analysis of (A) T stage, (B) N stage, (C) M stage, and (D) staging. (right) The boxplots of the relationship between the signature and (A) T stage, (B) N stage, (C) M stage, (D) staging, and (E) tumor type. Patients with higher level of T, N, M stages, advanced staging, and type 2 KIRP tended to have higher risk score
