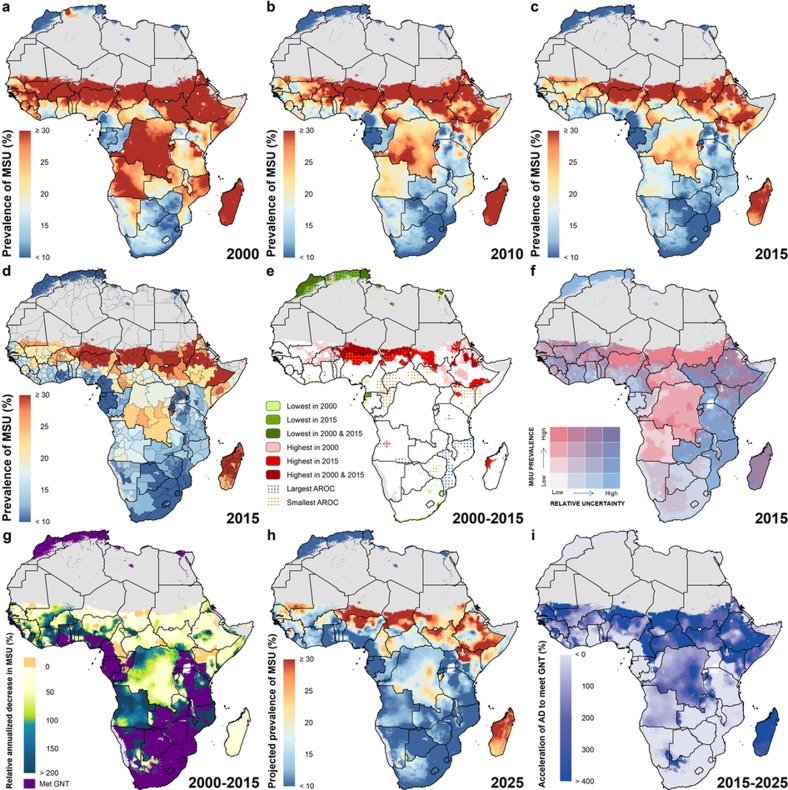
Figure 2. Underweight prevalence in children under five (2000–2015) and progress towards 2025.
a–c, Moderate and severe underweight (MSU) prevalence at the 5 × 5-km resolution in 2000 (a), 2010 (b) and 2015 (c). d, Underweight prevalence at the first administrative subdivision in 2015. e, Overlapping population-weighted lowest and highest 10% of pixels and annualized rates of change in underweight from 2000 to 2015 across the continent. f, Overlapping population-weighted quartiles of underweight and relative 95% uncertainty in 2015. g, Annualized decrease in underweight prevalence from 2000 to 2015 relative to rates needed during 2015–2025 to meet the WHO GNT. 100% indicates the annualized decrease from 2000 to 2015 equivalent to the pace of progress required during 2015–2025 to meet a 40% decrease in underweight by 2025, relative to 2010. Blue pixels exceeded this pace; green to yellow pixels proceeded at a slower rate than required; orange pixels were non-decreasing; and purple pixels were estimated to have met the target by 2015. This target was internally constructed, commensurate with the target for stunting, as there is no WHO GNT for underweight. h, Pixel-level underweight prevalence was predicted for 2025 on the basis of the annualized decrease achieved from 2000 to 2015 and projected from 2015 estimates. i, Acceleration in annualized decrease required to meet the WHO GNT by 2025. Purple pixels were either non-decreasing or must accelerate their rate of decline by more than 400% over 2000–2015 rates during 2015–2025 to achieve the target; white pixels require no increase. Maps reflect administrative boundaries, land cover, lakes and population; pixels with fewer than ten people per 1 × 1 km and classified as ‘barren or sparsely vegetated’ are coloured in grey44,45,46,47,48,49.

