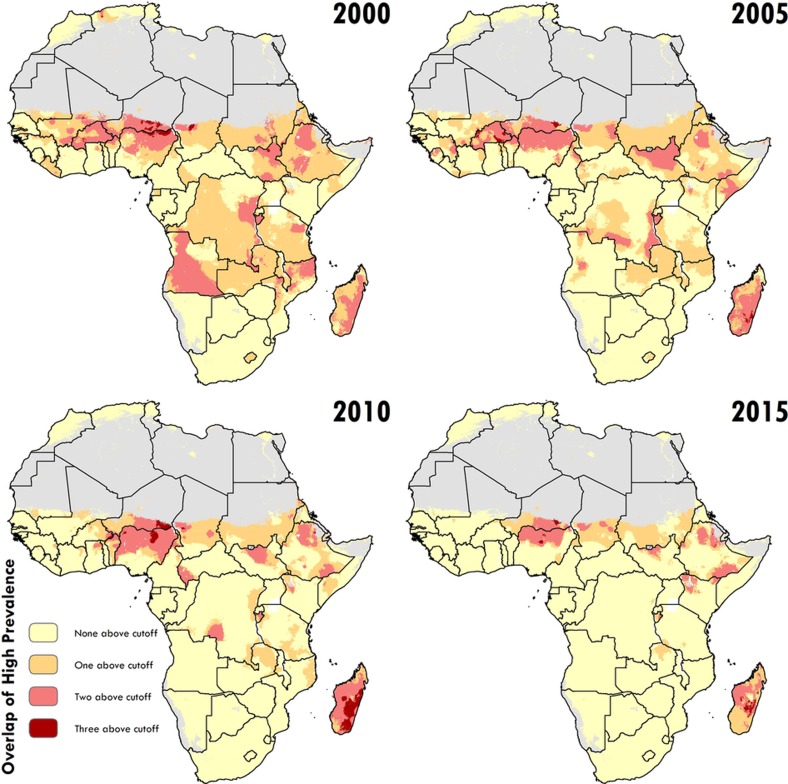
Figure 4. High prevalence across stunting, wasting, and underweight.
Across the modelling regions and 5-year periods, these plots show locations where the prevalence of one, two or three of the indicators falls above an upper bound (50% for stunting (HAZ), 25% for wasting (WHZ) and 30% for underweight (WAZ), which correspond to the upper cut-offs used in Figs 1a, 2a, Extended Data Fig. 2a). Maps reflect administrative boundaries, land cover, lakes and population; pixels with fewer than ten people per 1 × 1 km and classified as ‘barren or sparsely vegetated’ are coloured in grey44,45,46,47,48,49.

