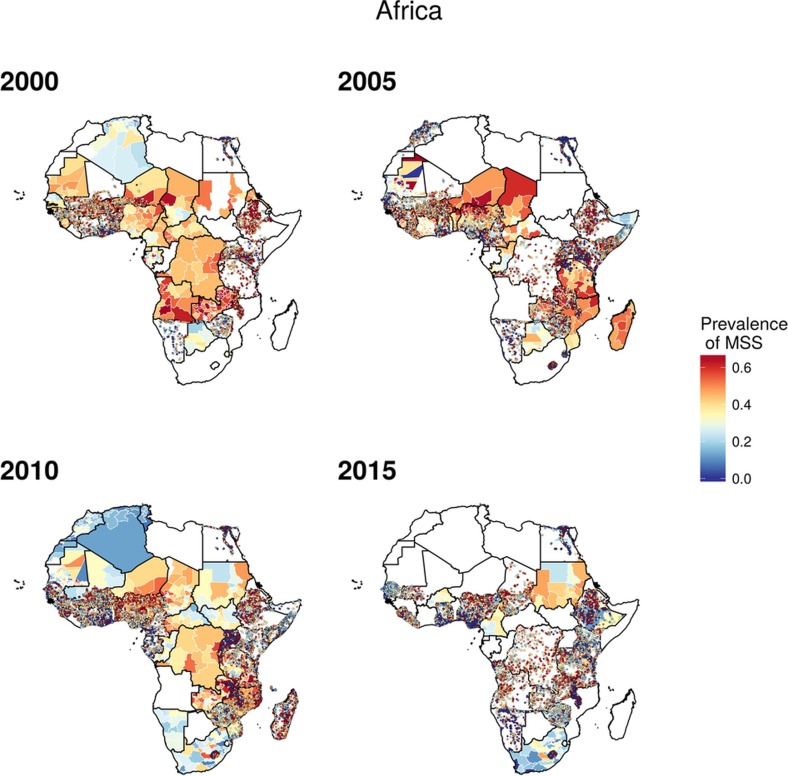
Figure 6. Stunting data availability map for 2000–2015.
All data are shown by country and year and mapped at their corresponding geopositioned coordinate or area. Mean stunting prevalence of the input coordinate or area is mapped. This database consists of 50,142 clusters and 4,253 polygons with a sample size totalling over 1.15 million children in Africa. Maps reflect administrative boundaries, land cover, lakes and population; pixels with fewer than ten people per 1 × 1 km and classified as ‘barren or sparsely vegetated’ are coloured in grey44,45,46,47,48,49.

