Figure 1.

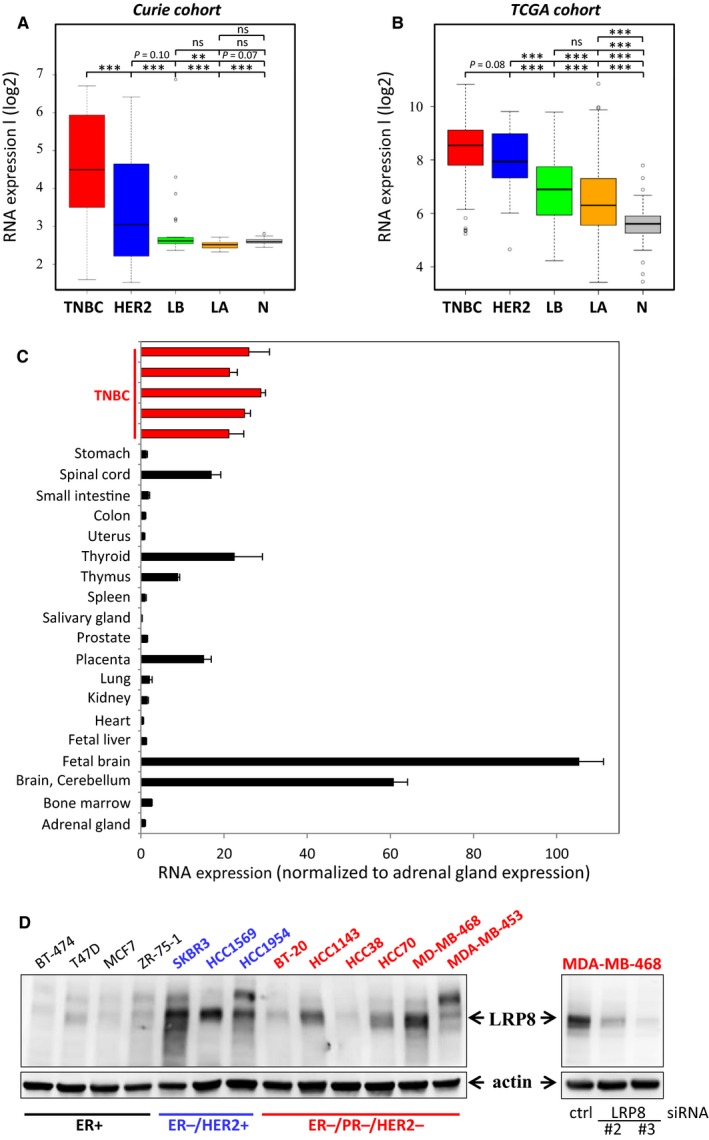
LRP8 is more strongly expressed in hormone receptor‐negative breast tumors than in luminal cancers, and expression levels are highest in TNBC. A‐B: LRP8 RNA levels in the different breast cancer subtypes. LRP8 RNA levels in (A) our cohort (Curie)22, 23 and (B) the publicly available TCGA cohort26; TNBC (red), HER2+/ER− (HER2, blue), luminal A (LA, orange), and luminal B (LB, green) cancers and normal breast tissues (N, gray). The relative levels of RNA have been subjected to a logarithmic (log2) transformation and are illustrated by boxplots. Outliers are shown within each population studied (open circles). Student's t test was used to compare RNA levels between two groups. The P values are indicated (*P < 0.05; **P < 0.01; ***P < 0.001; ns P > 0.1). C, LRP8 RNA levels in a panel of normal tissues (black bars). Comparisons with the levels found in our cohort were facilitated by including five TNBC samples with high levels of LRP8 expression (red bars) that were investigated in (A) in this analysis. LRP8 RNA levels were normalized relative to those in the adrenal gland (=1). D, LRP8 protein levels in a panel of 13 breast cancer cell lines (left panel) and in MDA‐MB‐468 cells transfected with one of the two siRNAs against LRP8 (#2 and #3) or with a control siRNA (right panel, also presented in Figure 2A). LRP8 and actin (used as a loading control) protein levels were assessed by Western blotting and indicated by arrows. On the left panel, an upper band can be seen but is not always observed depending of the protein lysate preparation. The cells lines indicated in black express the estrogen receptor (ER+), those in blue do not express ER but overexpress HER2 (ER−/HER2+), and the cell lines in red do not express ER and PR, and do not overexpress HER2 (ER−/PR−/HER2−). Of note, MDA‐MB‐453 (red) belongs to the luminal androgen receptor (LAR) TNBC subtype
